
Your whole body is based on a careful balance between acid and alkaline. In fact your life depends on it! So the body has several systems to make bicarbonates to neutralize the acid toxins prevalent in a cooked food lifestyle. This study helps support that.
Bicarbonate Increases Tumor pH and Inhibits Spontaneous Metastases
Published Online, March 10, 2009; doi: 10.1158/0008-5472.CAN-07-5575 Cancer Res March 15, 2009 69; 2260
Abstract
 The external pH of solid tumors is acidic as a consequence of increased metabolism of glucose and poor perfusion. Acid pH has been shown to stimulate tumor cell invasion and metastasis in vitro and in cells before tail vein injection in vivo. The present study investigates whether inhibition of this tumor acidity will reduce the incidence of in vivo metastases. Here, we show that oral NaHCO3 selectively increased the pH of tumors and reduced the formation of spontaneous metastases in mouse models of metastatic breast cancer. This treatment regimen was shown to significantly increase the extracellular pH, but not the intracellular pH, of tumors by 31P magnetic resonance spectroscopy and the export of acid from growing tumors by fluorescence microscopy of tumors grown in window chambers.
NaHCO3 therapy also reduced the rate of lymph node involvement, yet did not affect the levels of circulating tumor cells, suggesting that reduced organ metastases were not due to increased intravasation. In contrast, NaHCO3 therapy significantly reduced the formation of hepatic metastases following intrasplenic injection, suggesting that it did inhibit extravasation and colonization. In tail vein injections of alternative cancer models, bicarbonate had mixed results, inhibiting the formation of metastases from PC3M prostate cancer cells, but not those of B16 melanoma. Although the mechanism of this therapy is not known with certainty, low pH was shown to increase the release of active cathepsin B, an important matrix remodeling protease. [Cancer Res 2009;69(6):2260–8]
Introduction
The extracellular pH (pHe) of malignant solid tumors is acidic, in the range of 6.5 to 6.9, whereas the pHe of normal tissues is significantly more alkaline, 7.2 to 7.5 ( 1– 3). Mathematical models of the tumor-host interface ( 4) and in vivo measurements have shown that solid tumors export acid into the surrounding parenchyma ( 5, 6). Previous in vitro studies have shown that tumor cell invasion can be stimulated by acidic conditions and that this may involve lysosomal proteases ( 7– 9). These observations have led to the “acid-mediated invasion hypothesis,” wherein tumor-derived acid facilitates tumor invasion by promoting normal cell death and extracellular matrix degradation of the parenchyma surrounding growing tumors. Furthermore, pretreatment of tumor cells with acid before injection leads to increased experimental metastases ( 10, 11), and these observations suggest that low pH up-regulates proinvasive and survival pathways. It has been argued that metastatic cancers are selected for their ability to export acid ( 12). Acid is a by-product of glucose metabolism, and notably, elevated consumption of fluorodeoxyglucose by more aggressive cancers has been observed with fluorodeoxyglucose positron emission tomography ( 13).
The current work tests the hypothesis that neutralizing the acid pH of tumors will inhibit invasion and, hence, reduce the incidence of spontaneous metastases. Acid pH was inhibited using oral NaHCO3, which has previously been shown to effectively reverse pH gradients in tumors and not affect the pHe of normal tissues ( 14). This was confirmed in the current study using 31P magnetic resonance spectroscopy (MRS) and fluorescence ratio imaging of SNARF-1 in a dorsal skin-fold window chamber. Notably, bicarbonate did not affect the systemic pH or the growth rate of primary tumors but had significant effects on the formation of spontaneous metastases. In two of three experiments, NaHCO3 therapy reduced the colonization of lymph nodes, but in no experiment did it significantly affect the levels of circulating tumor cells. The lymphatic results notwithstanding, these results indicate that inhibition of end-organ metastasis did not occur by a reduction of intravasation. In contrast, the formation of liver metastases following intrasplenic injection of MDA-MB-231 cells was significantly reduced, indicating that end-organ colonization of metastatic sites was affected by NaHCO3 therapy. Similarly, metastases following tail vein injection of PC3M prostate cancer cells were also inhibited by bicarbonate treatment, yet those of B16 melanoma were not. Preliminary investigations into possible mechanisms showed that the release of active cathepsin B into pericellular space was significantly increased by acidic conditions, and thus, NaHCO3 therapy may be acting to inhibit the release of this important matrix remodeling protease.
Materials and Methods
Animals. All animals were maintained under Institutional Animal Care and Use Committee–approved protocols at either the University of Arizona or H. Lee Moffitt Cancer Center. Six- to eight-week-old female severe combined immunodeficient (SCID) mice were used as hosts for MDA-MB-231 tumors, 6-wk-old male SCID beige mice for PC3M tumors, and nu/nu mice for B16 tumors.
β-Galactosidase staining. Harvested lung tissue was sliced into 1-mm sections and placed in PBS containing 2 mmol/L MgCl2 (Mg-PBS) on ice. Sections were fixed in 0.5% glutaraldehyde in Mg-PBS on ice for 30 min and afterward rinsed in PBS to remove residual fixative. Fixed sections were then incubated for 3 h at 37°C in 5-bromo-4-chloro-3-indolyl-β-d-galactopyranoside reaction buffer (35 mmol/L potassium ferrocyanide, 2 mmol/L MgCl2, 0.02% NP40, and 0.01% Na deoxycholate in PBS). After incubation, the tissue sections were washed and stored in PBS. Sections were analyzed using a Stereomaster 4× dissecting microscope (Fisher Scientific) with mounted DC290 ZOOM digital camera (Eastman Kodak Company). Images were captured at the same focal plane with an exposure time of 1/10 s for white-light illumination. β-Galactosidase positive lesions were measured and counted manually by a blinded observer.
Intrasplenic injections. MDA-MB-231 cells (5 × 10⁵) expressing a thermostable firefly luciferase ( 15) were injected into the spleens of SCID mice. Three days postinjection, mice were randomized into bicarbonate and control therapies. Twenty-five days postinjection, spleens and livers were collected and placed in white, clear-bottom, sterile 12-well microtiter plates. Luciferase images were acquired using a VersArray 1300B cooled charge-coupled device camera (Roper Scientific) at 10-min exposures, f2.2. Image data were analyzed with ImageJ. After image acquisition, spleens and livers were homogenized in homogenization buffer (Promega) with five passes in a Dounce homogenizer, followed by addition of 1 volume of cell lysis buffer (Promega). Homogenates were mixed 1:1 with luciferase solution (Promega) and light emission was determined using a Wallac Victor3 (Perkin-Elmer) microtiter plate reader ( 16).
Intravasation. The first step of metastatic spread involves movement of cancer cells from the primary site into the bloodstream (intravasation) either directly or indirectly through the lymphatics ( 17). Measurement of MDA-MB-231/eGFP cells in the blood of tumor-bearing SCID mice was determined by three methods in two separate experiments. In one experiment (113007), untreated (n = 3) and 200 mmol/L bicarbonate–treated (n = 7) animals bearing primary tumors were euthanized after 36 d of tumor growth. At this time point, the primary tumors averaged 463 ± 33.5 mm3 in size in both groups. Blood was extracted by cardiac puncture into microfuge tubes and mixed with an equal volume of 100 mmol/L EDTA to prevent clotting. A blood volume of 10 μL was smeared on glass slides and dried. Green-fluorescing cells were counted manually under a fluorescent microscope at ×40 magnification. Nucleated cells from the remaining blood volume (∼300 μL) were obtained by centrifugation with Histopaque (Sigma), and resulting cells were resuspended in 96-well plates in 100 μL of PBS and measured on a Victor3 with excitation wavelength at 485 nm and emission at 535 nm. In another experiment (011508), blood was extracted by heart puncture from untreated and bicarbonate-treated mice (n = 8 each) by the same methods as above. Average tumor size was 121.8 ± 16.4 mm3. RBC were lysed with fluorescence-activated cell sorting lysing solution (BD Sciences) according to the manufacturer’s instructions. Cells were counter-labeled with LDS-751 nucleic acid dye and analyzed by flow cytometry on a FACScan (BD Biosciences) with a 488-nm argon laser. LDS-751 emits at 670 nm upon excitation at 488 nm and is detectable with the fluorescence 3 detector. Nonspecific fluorescence was differentiated from the green fluorescent protein (GFP) signal by gating on cellular light scattering properties and LDS-751.
Dorsal skin-fold window chamber. Tumor constructs were engineered using the tumor droplet method. MDA-MB-231 cells were suspended in 2.5 mg/mL type I collagen (BD Biosciences) and 1× DMEM at a final concentration of 1 × 10⁶ to 2.5 × 10⁶ cells/mL. Using a 48-well non–tissue-cultured plate, a 15-μL drop of the tumor cell suspension was polymerized in the center of the well. Following brief polymerization (∼1–2 min) at 37°C in the incubator, 200 mL of media [DMEM with 10% fetal bovine serum (FBS)] were added to the wells and the droplets were left until the addition of stromal mix. The stromal mix consisted of 3 mg/mL type I collagen, 1× DMEM, and ∼12,000 to 15,000 microvessel fragments/mL. Typically, when microvessel fragments are directly reconstituted with type I collagen, they undergo spontaneous angiogenesis by day 3 or day 4 in vitro and following implantation anastamose with the host vasculature and form a vascular network (days 4–7 in window chamber). After 2 d in culture, these constructs were removed with forceps and placed directly into the window chamber.
Because the tumors were relatively circular, growth was analyzed along the horizontal and vertical diameters. At the image magnification, each pixel was equal to ∼25 μm. The mean of the horizontal and vertical diameter was used to report the tumor diameter at the time of imaging. Tumor density was estimated based on the gray-level intensity homogeneity in the tumor region of interest. This estimated tumor density was calculated by first computing the gray-level co-occurrence matrix of tumor region. Using the gray-level statistics generated by the gray-level co-occurrence matrix, the gray-level intensity homogeneity was calculated, a metric reflective of the likelihood that neighboring pixels are the same intensity. A higher homogeneity value was suggestive of a denser tumor because the intensities would vary less from pixel to pixel in regions of high cellularity.
Cathepsin-B activity. Cathepsin-B measurements were carried out in a “real-time” assay as described by Linebaugh and colleagues ( 18). Briefly, cells were exposed to a fluorogenic substrate (Z-Arg-Arg-NHMec) in an enclosed system that monitored the rate of fluorescent product (NH2Mec) formation. MDA-MB-231 cells grown on coverslips to 60% to 80% confluence, washed with Dulbecco’s NaCl/Pi, and equilibrated in assay buffer without substrate at 37°C for 5 min. Measurements consisted of (a) a fluorescence baseline for the assay buffer containing 100 μmol/L Z-Arg-Arg-NHMec substrate for 5 min; (b) the rate of fluorescent product formation due to the introduction of cells followed over 10 min; (c) the rate of fluorescent product formation after removal of cells from the cuvette followed over 10 min; and (d) the rate of fluorescent product formation when cells are placed back in cuvette and cell membrane permeabilized by adding 0.1% (v/v) Triton X-100. Cathepsin-B activity was measured following equilibration of cells in media containing 25 mmol/L PIPES at pH 6.8 and 7.4 for 3 d, followed by overnight incubation in 0.2% FBS at the respective pH values. A cathepsin-B inhibitor, CA074, was added at a final concentration of 10 μmol/L to confirm that the activity measured was due to cathepsin B ( 19). Measurements were recorded in a Shimadzu RF-450 spectrofluorometer, with excitation at 380 nm and emission at 460 nm, equipped with a temperature-controlled cuvette holder, microstirrer, and a DR-3 data chart recorder. After data acquisition, the DNA content on each coverslip was determined by measuring fluorescence using SYBR Green I nucleic acid stain (Molecular Probes) in a microtiter plate at 485-nm excitation and 535-nm emission. Concentrations were calculated based on the salmon sperm DNA standard curve. The rate of product formation was expressed as picomoles per minute per microgram of DNA.
Statistics. All statistical calculations were determined using the analysis feature in Prism version 4.03 for Windows (GraphPad Software) or Microsoft Excel. To compare two means, statistical significance was determined by unpaired, one-tailed Student’s t tests assuming equal variance. If variances were significantly different (P < 0.0001), a Welch’s correction for unequal variances was applied. A log-rank test was applied to survival data. A Mann-Whitney-Wilcoxon rank-sum test was used to compare independent groups whose data were ordinal but not interval-scaled.
Results and Discussion
In initial experiments, metastatic MDA-MB-231 adenocarcinoma cells were orthotopically injected into mammary fat pads of female immunodeficient (SCID) mice. Six days after injection, mice were randomized into two groups: one (control) was provided with drinking water and the other (bicarbonate) was provided with 200 mmol/L NaHCO3 ad libitum, which continued for the duration of the experiment. Bicarbonate therapy had no effect on either the animal weights or the rates of growth of the primary tumors. The lack of effects on animal weights (P = 0.98) is shown in Supplementary Fig. S1A, and these data were interpreted to indicate that this therapy did not lead to dehydration because dehydration quickly leads to significant weight loss in experimental mice. Bicarbonate-treated mice drank, on average, 4.2 ± 0.2 mL of water per day, whereas control mice consumed 3.3 ± 0.1 mL/d. The daily intake of bicarbonate was thus calculated to be 36 ± 1.7 mmol/kg/d (9.4 g/m2/d). An equivalent dose in a 70-kg human would be 12.5 g/d ( 20). The lack of an effect on the growth of the primary tumors (P = 0.80) is shown in Supplementary Fig. S1B to D. Although bicarbonate effectively increased the pHe of these large tumors, it did not affect the intracellular pH (pHi), as measured by MRS (see below), and this may be reflected in a lack of an effect on growth rates ( 21, 22).
Despite a lack of an effect on primary tumor growth, bicarbonate therapy led to significant reductions in the number and size of metastases to lung, intestine, and diaphragm. Figure 1A and B shows the size and number of β-galactosidase expressing spontaneous lung metastases after 30 and 60 days of primary tumor growth, respectively. In the 30-day experiment, pooled data (n = 12 mice per group) showed that the bicarbonate-treated mice had a total of 147 metastatic lung lesions, whereas the control group had 326 lung lesions (P = 0.03). The average lesion diameters (± SE) were 4.5 ± 0.12 and 5.2 ± 0.14 mm in the NaHCO3 and control groups, respectively (P < 0.0001). In the 60-day experiment (n = 20 and 15 for control and NaHCO3 groups, respectively), the numbers of pixels associated with lesions >60 μm in diameter were scored. The average numbers of lesion pixels per animal in control and NaHCO3 groups were 382 and 74, respectively (P = 0.0004). None of the animals treated with NaHCO3 had more than 240 lesion pixels per animal, whereas 10 of 20 of the control animals had more than 240 lesion pixels. Both experiments showed dramatically fewer lesions in the bicarbonate-treated group than in control animals.
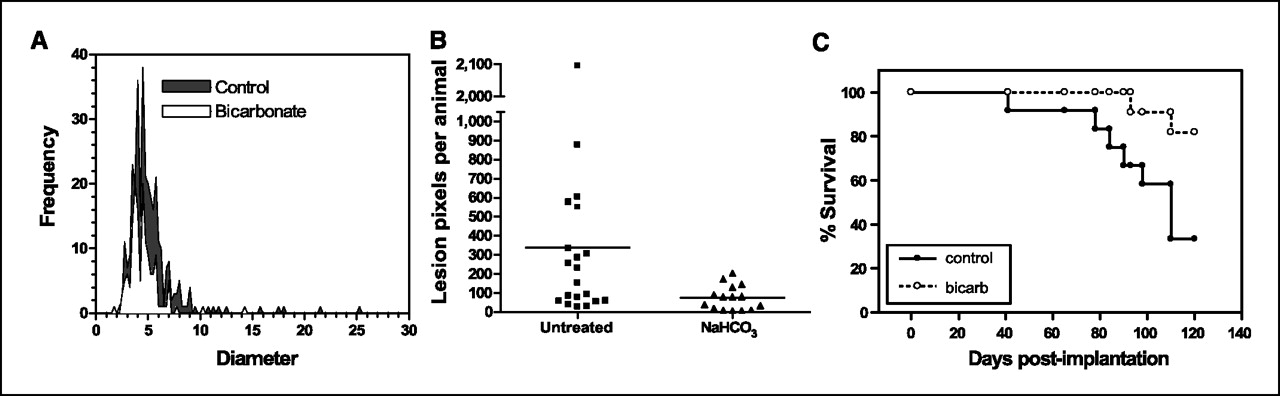
Figure 1.
Effect of NaHCO3 on metastases and survival. MDA-MB-231 were obtained from American Type Culture Collection and maintained in growth media (DMEM/F-12 supplemented with 10% FBS) at 37°C with 5% CO2 in a humidified atmosphere. These cells were stably transfected with expression vectors for hygromycin-resistant pcDNA3.1/LacZ (Invitrogen). These β-gal–labeled MDA-MB-231 cells (107), suspended in 0.2 mL of 0.8% sterile saline, were injected s.c. into the left inguinal mammary fat pads of 6-wk-old female SCID mice. Mice (n = 8) were started on drinking water (ad libitum) supplemented with 200 mmol/L NaHCO3 at 6 d postinjection and maintained along with untreated animals (n = 8). After 30 d of primary tumor growth, the animals were sacrificed and the β-gal–positive lung lesions were counted and sized after staining, as shown in A. Mean lesion diameters (P < 0.0001) and frequencies (P = 0.0342) were significantly different between the two groups as determined by two-tailed unpaired t test with Welch’s correction for unequal variances. In a repeat of this experiment, 106 β-gal-MDA-MB-231 cells were injected into inguinal mammary fat pads, and control (n = 9) and NaHCO3-treated (n = 15) animals were maintained for 60 d before sacrifice. In this experiment, lung images were analyzed using ImagePro Plus to determine the metastatic tumor burden by counting the number of β-gal–positive pixels per animal. B, numbers of lung lesions per animal following 60 d of growth in the presence of NaHCO3 in drinking water. The frequency of lesions per animal in the NaHCO3-treated mice was compared with that in untreated controls by unpaired t test (P = 0.0004). In a third experiment, MDA-MB-231 cells were stably transfected to express neomycin-resistant pcDNA3/EGFP (a gift from Peter Ratcliffe, Oxford University, Oxford, United Kingdom). MDA-MB-231/eGFP cells (6.5 × 10⁶) were injected into inguinal mammary fat pads of animals that were randomized into bicarbonate and control groups (n = 12 per group) 6 d postinoculation. Tumors were allowed to grow for 5 to 6 wk (to a volume of ∼600 mm3), at which time they were surgically removed. If the primary regrew (as was the case in 9 of 24 animals), it was resected again. Animals were monitored biweekly and maintained on bicarbonate or water until they evidenced a lymph node lesion >300 mm3 in size, at which time they were sacrificed and necropsied by examination with a fluorescence dissecting scope. Data from this experiment are plotted as a Kaplan-Meier survival curve (C). The difference in the survival curve for the bicarbonate versus control animals was tested using the log-rank test (P = 0.027).
This reduction in metastases also led to increased survival. Figure 1C shows the Kaplan-Meier survival curve, which shows that bicarbonate therapy increased survival (log-rank; P = 0.027). As shown in Fig. 2 , on necropsy, the control group contained significant and notable fluorescent lung lesions, whereas the bicarbonate group had little, if any, fluorescence (Wilcoxon rank-sum test, P = 0.0015). These data were quantified for other metastatic sites in all animals and showed reductions in frequency and fluorescence density in visceral organ (intestines, pancreas, liver, spleen, bladder, and liver) and mesenteric metastases in the bicarbonate-treated groups ( Fig. 3A ). These data are notable in that the effect of the bicarbonate therapy was greater than in any of the previous experiments, yet the median ages of sacrifice were >100 days for both control and bicarbonate groups (i.e., significantly longer than either of the previous experiments).
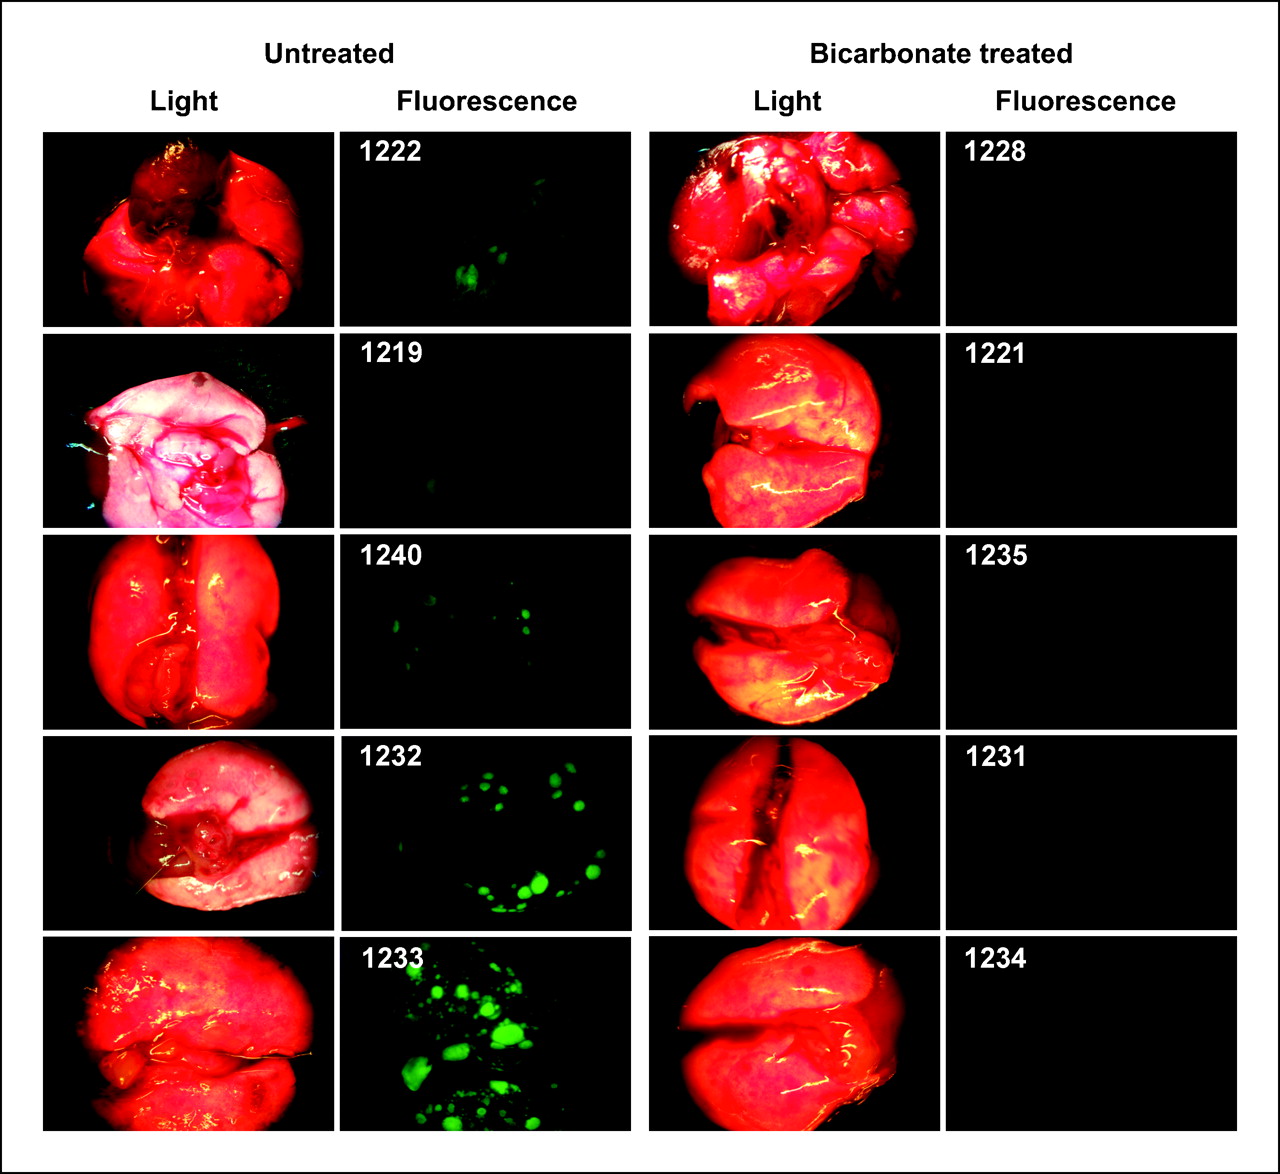
Figure 2.
Lung metastases. Images were obtained at time of sacrifice from individual (numbered) mice in control and bicarbonate groups of the experiment shown in Fig. 1C. At time of necropsy, organ and lymph node green fluorescent tumor metastases from necropsies were detected by the Illumatool Bright Light System (LT-9500) using a 470 nm/40 nm excitation filter (Lightools Research) and imaged using a Stereomaster 4× dissecting microscope (Fisher Scientific) with mounted DC290 Zoom digital camera (Eastman Kodak). Images were captured at the same focal plane in the presence of 480-nm excitation and >490-nm filtered emission with an exposure time of 4 s for GFP images and 1/10 s for white-light illumination. Image data were analyzed with ImageJ (http://rsb.info.nih.gov/ij/) by segmenting the green channel and counting total positive pixels per field.
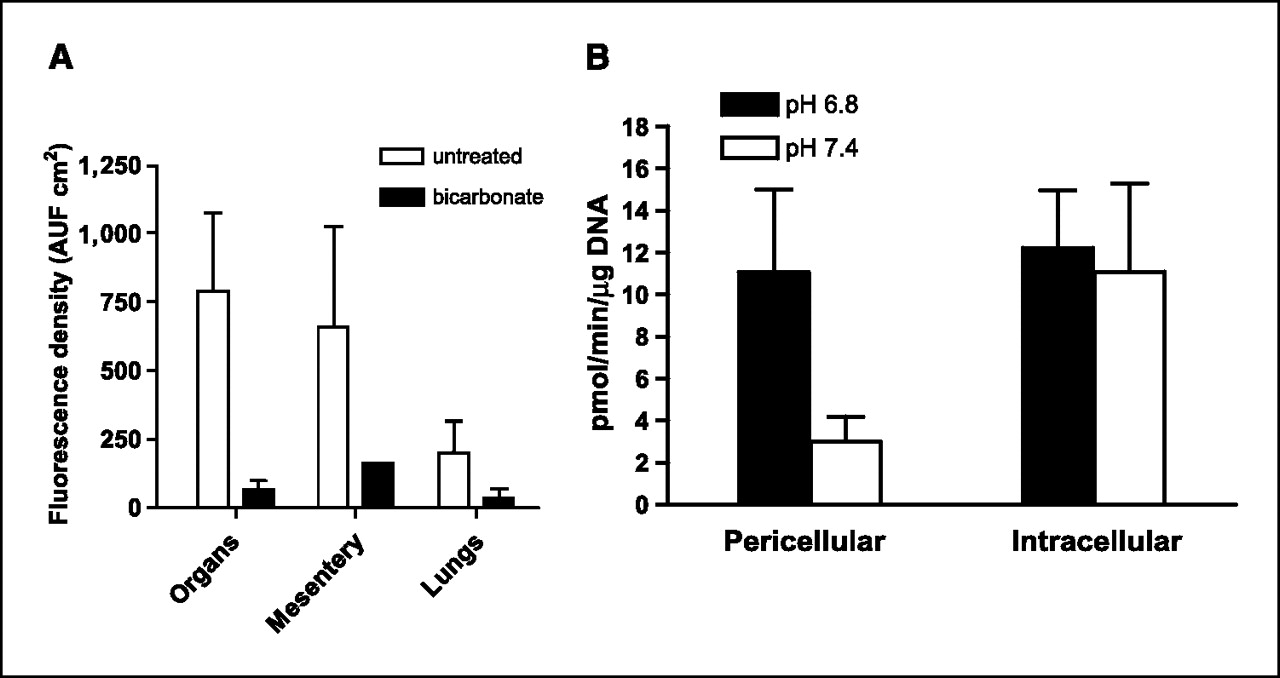
Figure 3.
Metastases and cathepsin B activity. A, at time of sacrifice, animals in the survival experiment shown in Fig. 1C were necropsied and metastases were quantified by fluorescence. Images were captured as described in Fig. 1C and fluorescence was quantified following RGB segmentation using ImageJ analysis software. Columns, average fluorescence pixel densities (fluorescence intensities × area) for lymph nodes, visceral organs, mesentery, and lungs; bars, SE. AUF, arbitrary units of fluorescence. B, red fluorescent protein–expressing MDA-MB-231 tumor cells were incubated at low and high pH values for 4 d, and then overnight in 0.2% serum media, followed by assessment of pericellular and intracellular cathepsin B activity in live cells via a “real time assay”, as described in Materials and Methods.
Although it has previously been shown that chronic oral NaHCO3 can lead to reversal of tumor acidosis ( 14), this was confirmed here for the MDA-MB-231 tumor model using 31P MRS of tumor-bearing animals after 3 weeks of therapy (4 weeks postinoculation). pHi was measured with the resonant frequency of inorganic phosphate, and pHe was measured with the exogenous pH indicator 3-aminopropylphosphonate ( 23, 24). 31P spectra of NaHCO3-treated tumors exhibited significant shifts in the resonant frequency of 3-aminopropylphosphonate, with little or no change in the frequency of inorganic phosphate ( Fig. 4 ). Average pHe values were 7.4 ± 0.06 in the NaHCO3-treated tumors, compared with pH 7.0 ± 0.11 under control conditions ( Fig. 4, inset). Notably, the pHi of tumors was unaffected, being 7.0 ± 0.06 and 7.1 ± 0.09 under treated and control conditions, respectively ( Fig. 4, inset). The pHi and pHe were also measured in nontumor tissues in the same animals (e.g., hind limb muscle) with the observation that the pHi and pHe were unaffected by bicarbonate, being 7.22 ± 0.04 and 7.40 ± 0.08, respectively, in both groups (data not shown), which was consistent with previous results ( 14).
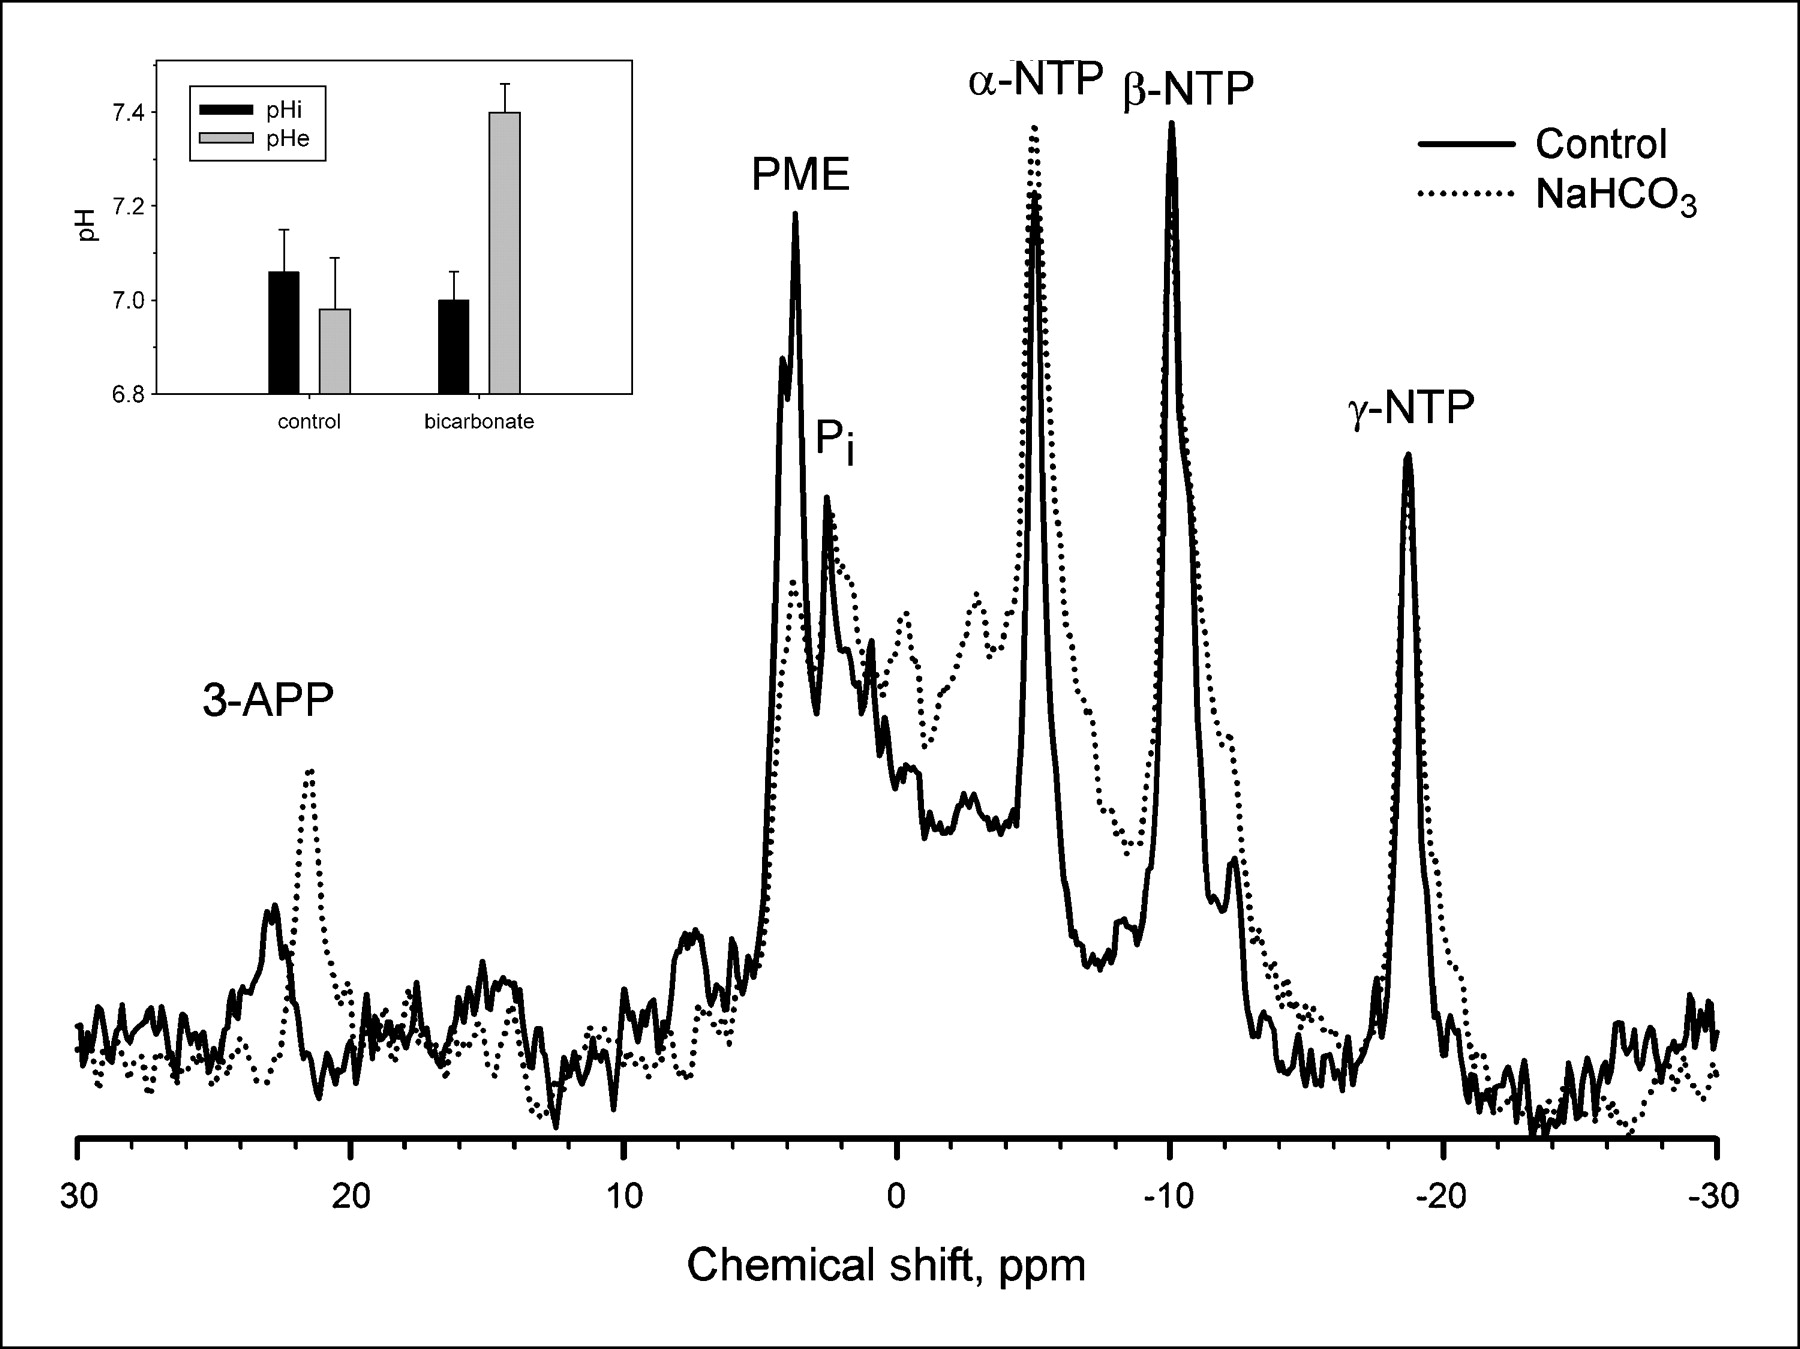
Figure 4.
The effect of NaHCO3 treatment on tumor pH. All in vivo measurements were done at 4.7 T on a Bruker Biospec magnetic resonance imaging spectrometer equipped with a 14 G/cm self-shielded gradient insert, using volume excitation and home-built solenoid coils for reception. Image-guided volume-selective 31P magnetic resonance spectra of tumors in anesthetized mice were acquired as described in ref. 14. The pHe and pHi were measured from the chemical shifts of exogenous 3-aminopropylphosphonate and endogenous inorganic phosphate, respectively ( 17). For spectroscopy of tumors, 0.4 mL of 0.24 mol/L 3-aminopropylphosphonate was administered i.p. to mice a few minutes before anesthetization. Following anesthetization, a further 0.4 mL of 3-aminopropylphosphonate was injected i.p., and the mouse prepared for 31P MRS as before. This figure illustrates representative 31P magnetic resonance spectra from control (solid) and NaHCO3-treated (dotted) MDA-MB-231 tumor xenografts. 3-APP, 3-aminopropylphosphonate; Pi, endogenous inorganic phosphate; PME, phosphomonoesters; NTP, nucleoside triphosphate. Inset, columns, average values for tumor pHi (P = 0.89) and pHe (P = 0.01) in the absence and presence of bicarbonate treatment (n = 6 mice each); bars, SE. Details of the acquisition and processing parameters are provided in Materials and Methods.
Despite significant effects on the formation of metastases and tumor pHe, chronic bicarbonate therapy had no effect on blood chemistries, indicating that systemic pH was fully compensated in these animals (Supplementary Table S1). Thus, as expected due to the chronic nature of the treatment, NaHCO3 did not lead to systemic metabolic alkalosis. Rather, we hypothesize that inhibition of tumor metastasis was due to increased bicarbonate “buffering” of interstitial fluid of either the primary or the metastatic tumors. Thus, the bicarbonate levels in tumors were increased to be consistent with the rest of the body, leading to a selective increase in tumor pHe. This effect has been modeled using reaction diffusion kinetic modeling ( 25) and showed that (a) in the face of a high acid load from hypermetabolic tumor cells, the bicarbonate effect will be incomplete even at 200 mmol/L; and (b) alternative buffers with higher pKa values should be more efficacious. Consistent with these predictions, a dose-response experiment with a 30-day end point showed that concentrations as low as 50 mmol/L reduced the incidence of spontaneous metastases, yet the largest effect was observed at the highest dose investigated, 200 mmol/L (Supplementary Table S2), indicating that, even at this dose, the effect is incomplete. The lack of a complete effect was further investigated by inoculating mice (n = 3 per group) bearing dorsal skin-fold window chambers with GFP-transfected MDA-MB-231 tumor cells. As above, ad libitum 200 mmol/L NaHCO3 was begun 6 days postinoculation. After 1 and 2 weeks of therapy, the pHe was measured by fluorescence ratio imaging of SNARF-1, as described in Materials and Methods ( 5). Representative GFP images used for segmentation are shown in Supplementary Fig. S2. These were used to define a region of interest delineating the tumor boundary, indicated by the solid red line. The corresponding SNARF-1 ratio-derived pHe images for control and bicarbonate-treated animals are shown in Fig. 5A and B , respectively. Note that pHe is more acidic in the control tumors and that this acidity extends beyond the tumor boundary, whereas the acid pHe regions of the bicarbonate-treated mice were confined within the tumor volume. Data were analyzed along coaxial radial lines drawn from the centroid of the tumor ( Fig. 5C) and the least squares fit for all experiments is shown in Fig. 5D, with the centroid located at “0” and the edge of the tumor indicated by the vertical line. Table 1C shows that, whereas the intratumoral pHe was not significantly affected in the bicarbonate group (P = 0.19), the peritumoral pHe, measured within 0.2 mm of the tumor edge, was significantly higher in the bicarbonate-treated group compared with controls (P = 0.05). Thus, both fluorescence and MRS showed higher tumor pHe values in the bicarbonate-treated groups, although the MRS showed a greater effect. These apparent differences may be due to the different preparations, such as measurement by two different techniques (MRS versus fluorescence) in two different systems (orthotopic versus heterotopic) following two different treatment times (21 versus 7 days). Follow-up imaging of window chambers 7 days later showed that the changes in tumor diameters were not significantly different between groups, but that there were significant (P = 0.002) differences in the tumor densities. Specifically, the densities increased with time in the control tumors and decreased in the bicarbonate-treated tumors. Whereas the importance of these observations is not clear, it may lead to a practical application. Tumor cell densities can be measured noninvasively using diffusion-weighted magnetic resonance imaging ( 26), and hence, this imaging modality may be useful as a quantitative biomarker for the effects of bicarbonate therapy in vivo.
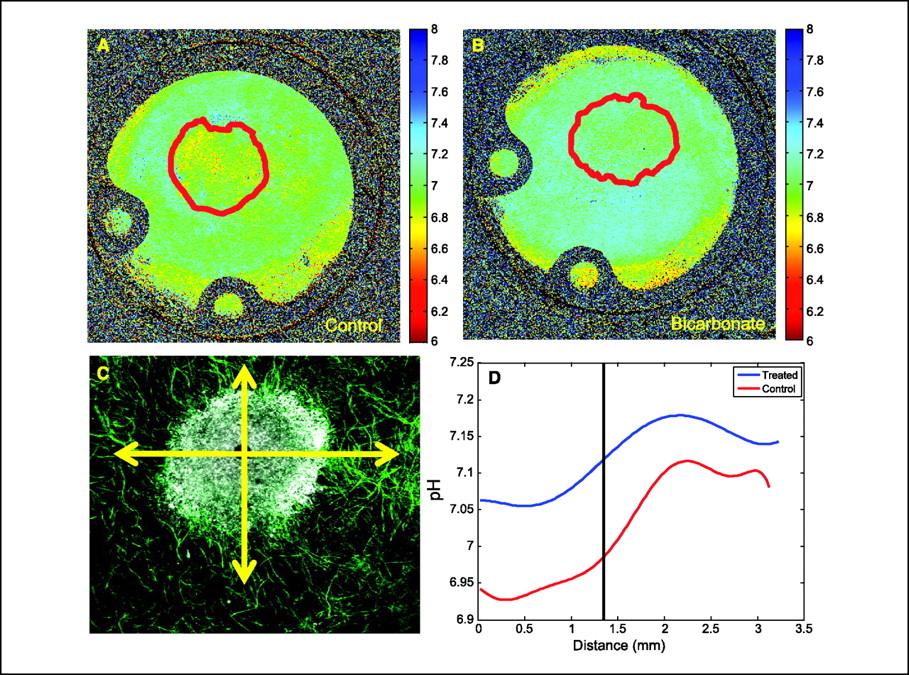
Figure 5.
Microscopic pH gradients in window chambers. Tumors were inoculated into window chamber as described in Materials and Methods. pHe was measured following injection of SNARF-1 free acid by excitation with a He/Ne laser at 543 nm and emissions were collected in channel 1 with a 595/50-nm bandpass and in channel 2 with a 640-nm-long pass filter. Confocal images were converted to .tif format using ImageJ (http://rsb.info.nih.gov/ij/); respective background images were subtracted from each fluorescence image (red channel, blue channel); and image was then smoothed with a 2 × 2 kernel. The two images were then divided, subsequently removing zeros and not-a-numbers (NANs), creating a ratiometric image. The in vitro pH calibration was then applied to every pixel in the ratiometric image. Regions of interest were drawn around the tumor, the proximal peritumor region, and the distal “normal” region, and the mean pHe was calculated in these regions. The spatial pH distribution was calculated by drawing an intensity profile (5 pixels wide) from the center of the tumor out to the edge of the window chamber. These profiles were drawn in four orthogonal radial directions, originating from the tumor centroid. The pH profiles were then aligned so that they coincided at the tumor margin using the GFP image to determine the tumor rim. Representative pHe images are shown for untreated (A) and bicarbonate-treated (B) mice (10 × field of view, 12.5 mm). Red lines, region of interest of tumor, defined by GFP images, shown in Supplementary Fig. S2. C, merged confocal image of tumor (white) surrounded by a labeled microvascular network (green). Radial lines, directions along which pHe values were measured. D, least-square fit across all directions and all tumors showing pHe distributions along radial lines for control and bicarbonate-treated tumors. “0” is centroid of tumor, and vertical line indicates tumor edge.
Table 1.
Quantitative analysis of intravasation, extravasation, and pH
| Control | Bicarbonate | P * | |||
| (A) Intravasation | |||||
| n | Mean (range) | n | Mean (range) | ||
| Manual (no. of cells) | 3 | 0 (0) | 7 | 1.3 (0–7) | NS |
| Fluorescence (AUF) | 3 | 124 (70–180) | 7 | 746 (0–4,358) | NS |
| Flow (cells/100 μL) | 8 | 3.6 (0–13) | 8 | 1.5 (0–10) | NS |
| (B) Extravasation | |||||
| n | Mean (SE) | n | Mean (SE) | P | |
| Liver | 3 | 109.0 (46.0) | 3 | 11.9 (10.3) | 0.007 |
| Spleen | 3 | 231.6 (3.6) | 3 | 608.0 (56.0) | 0.011 |
| Ratio | 3 | 0.54 (0.25) | 3 | 0.035 (0.020) | <0.001 |
| (C) pH and growth data from window chambers | |||||
| n | Mean (SE) | n | Mean (SE) | P | |
| Intratumor pHe | 4 | 7.00 (0.04) | 3 | 7.07 (0.03) | 0.19 |
| Peritumor pHe | 4 | 7.06 (0.00) | 3 | 7.16 (0.03) | 0.05 |
| Distant pHe | 4 | 7.11 (0.03) | 3 | 7.15 (0.03) | 0.14 |
| ΔDiameter | 4 | −2.07 (13.32) | 3 | −5.88 (2.51) | 0.39 |
| ΔDensity | 4 | 0.71 (0.26) | 3 | −3.29 (1.07) | 0.002 |
- NOTE: See Materials and Methods for experimental and analytic details. Abbreviations: AUF, arbitrary units of fluorescence; NS, not significant. * P value from nonpaired Student’s t
To begin investigating the mechanism of the bicarbonate effect, experiments were designed to separate early events (intravasation) from later events (extravasation and colonization) of the spontaneous metastasis paradigm. Spontaneous metastases occur via movement of tumor cells from the primary tumor into the bloodstream (intravasation), either directly or indirectly through the lymphatics. In xenografts, this can involve active local invasion or a passive process of shedding ( 27). Following intravasation, the circulating tumor cells lodge and colonize in distant sites. There is some controversy whether this occurs via simple lodging of circulating tumor cells in small vessels (prompting local ischemia) or whether it involves specific interaction of circulating tumor cells with post-capillary endothelia followed by extravasation ( 17, 28). To investigate the effect of bicarbonate therapy on intravasation, the incidences of lymphatic involvement and circulating tumor cells were quantified. Lymph node status was assessed in SCID mice inoculated with GFP-expressing MDA-MB-231 tumor cells, which were randomized into control (n = 12) and bicarbonate-treated (n = 11) groups. Primary tumors were grown for 40 days (to volumes of 800–1000 mm3), at which time the animals were sacrificed and lymph nodes and other organs examined by fluorescence imaging. For the purpose of scoring, lymph nodes were characterized as “trace,” with a few fluorescent colonies, or “positive,” wherein the entire lymph node was inflamed. Examples of these are shown in Supplementary Fig. S3. Mice were scored from 0 to 6, as described in Supplementary Table S3, and these analyses showed that most had lymphatic involvement, with those of the NaHCO3-treated animals being less developed. The majority of the NaHCO3-treated animals (9 of 12) had only traces of fluorescence in their lymph nodes, whereas 7 of 11 of the control group had strongly positive nodes and/or metastases (P = 0.044, Mann-Whitney-Wilcoxon). Similarly, the lymph node involvement in the survival study showed a more significant effect on the development of lymph node metastases to >300 mm3 (log-rank P = 0.02). As a further test of intravasation, circulating tumor cells were measured in blood from mice bearing GFP-expressing tumors by manual counting of whole blood smears, flow cytometry following erythrocyte hemolysis, and raw fluorescence of blood extracts. With all end points, there were low numbers of circulating tumor cells and no evidence to suggest differences between bicarbonate-treated and control groups ( Table 1A). From these data, we conclude that, whereas bicarbonate may have an effect on lymph node colonization, this does not conclusively lead to an increase in the numbers of circulating tumor cells, although this conclusion is tempered by the low numbers of circulating tumor cells in both conditions.
The effect of bicarbonate therapy on extravasation was measured in two ways. Because breast cancer commonly metastasizes to the liver, the incidence of liver metastases 21 days after intrasplenic injection of 104 luciferase-expressing MDA-MB-231 cells was used as a measure of extravasation for this system ( 29). Table 1B shows that the luciferase levels in livers of bicarbonate-treated mice were significantly lower than those in controls, whether expressed as raw counts or normalized to splenic luciferase values. Thus, in this system, bicarbonate therapy had a more pronounced effect on the process of extravasation and colonization compared with intravasation. The generality of this phenomenon was examined in other cancer models by monitoring metastases following tail vein injection of luciferase-expressing PC3M human prostate cancer cells or B16 mouse melanoma cells. Supplementary Fig. S4 shows luciferase images from both systems that show a clear difference in the PC3M system and a clear lack of an effect in the B16 system. The progression of metastases in PC3M is shown in Supplementary Fig. S5, with the difference between bicarbonate and controls groups being significant (P = 0.04) at 35 days. Although the differences in the B16 system were not significantly different, the pooled values for the bicarbonate group were consistently lower than those of controls at all time points (data not shown). It should also be noted that the B16 tumors are much faster growing, leading to termination of all animals at 17 days, compared with >42 days for the PC3M tumors. Thus, either these cells colonize in a pH-independent fashion or their rates of acid production simply overpower the ability of bicarbonate to effectively buffer the pH ( 25). Nonetheless, these data show that, for at least two human cancers (MDA-MB-231 and PC3M), bicarbonate reduces the efficiency of tumor colonization at distant sites.
The effects of bicarbonate observed in this study could be exerted at either the primary or the metastatic site, and these are currently under investigation. On one hand, it may be that the acid pH of the primary tumor induces a stress response in these cells, leading to increased survival. This would be consistent with previous observations of Hill and Rofstad, who showed that pretreatment of melanoma cells with acid pH before injection leads to enhanced survival at metastatic sites ( 10, 11). Alternatively, it is possible that the bicarbonate buffering inhibits local invasion at the metastatic site. This has been formulated as the acid-mediated invasion hypothesis, wherein tumor-derived acid is excreted into the surrounding parenchyma, leading to degradation of the surrounding extracellular matrix ( 5).
Whether at the primary or the metastatic site, acid pH seems to stimulate invasive behavior and increased survival, either by selection or induction ( 7– 9). Acid pH has been shown to induce the expression and activity of a number of systems involved in matrix remodeling. These include matrix metalloproteinases such as collagenase (MMP1) or gelatinases (MMP-2 or MMP-9; refs. 8, 10, 30); lysosomal proteases such as cathepsin B, D, or L ( 9, 31, 32), which may result from acid-induced lysosomal turnover ( 7, 33); and hyaluronidase and the hyaluronan receptor CD44 ( 34– 36). Additionally, low pH can stimulate neoangiogenesis through induction of vascular endothelial growth factor or interleukin-8 ( 10, 37– 39), or it may stimulate invasion simply by inducing apoptosis in parenchymal cells ( 40, 41), as we have previously shown ( 5), at the same time selecting for tumor cells that are apoptosis resistant. Notably, CD44 is associated with breast cancer cells with stem cell–like properties, and these are noted for being resistant to environmentally induced apoptosis ( 42, 43). To begin investigating the myriad of possible molecular mechanisms, we assayed cathepsin B ( 18) in acid-treated MDA-MB-231 cells, and we observed that the activity of this protease secreted into the media was increased up to 4-fold, with no effect on the cell-associated activities ( Fig. 3B). Thus, it seems that the acid pHe of tumors can induce the release of this protease that is involved in extracellular matrix turnover in breast cancer ( 44). Experiments are under way to determine if bicarbonate therapy will inhibit this activity in vivo.
Conclusions
The above data have shown that oral bicarbonate therapy significantly reduced the incidence of metastases in experimental models of breast and prostate cancer and that the effect seems to be primarily on distal (i.e., colonization), rather than proximal (i.e., intravasation), processes. It is not known whether bicarbonate is exerting its effects by decreasing survival of circulating tumor cells (although the numbers are not affected) or by inhibiting colonization at the metastatic site. Increases in pHe significantly reduced the release of a lysosomal protease, cathepsin B.
Medically, the idea of treating cancer through p.o. administration of buffers is attractive but tethered to caveats. Reaction diffusion models show that the effect of bicarbonate on the pHe gradient will be graded with dose and that, at the current dose of 200 mmol/L, is not saturating. This dose translates to an intake of ∼1.5 μmol/h/g of whole mouse. By comparison, the acid production rate of tumors can be ∼100 μmol/h/g of tumor weight ( 45). Thus, these doses of NaHCO3 may be able to counteract the acid load of a 15-mg tumor, which translates to ∼105 cells or a 1-mm3 micrometastasis. The effectiveness of this therapy will be reduced with larger tumors ( 25). It is somewhat surprising that this incomplete effect had such a dramatic effect on metastases. Another concern is that bicarbonate, with an effective pKa of 6.24, would seem to be poorly suited as an alkalinizing buffer; thus, it is possible that better pHe control and more dramatic antimetastatic effects will be observed with a higher pKa buffer. However, it remains possible that this effect may be specific for buffers in the bicarbonate/CO2 family through involvement of carbonic anhydrase activity, which is important to pH regulation in tumors ( 46). Notwithstanding these concerns, however, the dramatic effect of bicarbonate therapy on the formation of breast cancer metastases in this model system warrants further investigation.
Acknowledgments
Grant support: NIH grant CA 077575 (R.J. Gillies).
We thank Libia Luevano, Bethany Skovan, Wendy Tate, James Averill, Maria Lluria-Prevatt, Kathy Brown, and Merry Warner (at University of Arizona) and Robert Engelman, Noreen Leutteke, and Dominique Pasqualini (at Moffitt Cancer Center) for their contributions to this work.
References
- Griffiths JR. Are cancer cells acidic? Br J Cancer 1991; 64: 425–7. Medline
- Vaupel P, Kallinowski F, Okunieff P. Blood flow, oxygen and nutrient supply, and metabolic microenvironment of human tumors: a review. Cancer Res 1989; 49: 6449–65. Abstract/FREE Full Text
- Wike-Hooley JL, Haveman J, Reinhold HS. The relevance of tumour pH to the treatment of malignant disease. Radiother Oncol 1984; 2: 343–66. Medline
- Gatenby RA, Gawlinski ET. Mathematical models of tumour invasion mediated by transformation-induced alteration of microenvironmental pH. Novartis Found Symp 2001; 240: 85–96. Medline
- Gatenby RA, Gawlinski ET, Gmitro AF, Kaylor B, Gillies RJ. Acid-mediated tumor invasion: a multidisciplinary study. Cancer Res 2006; 66: 5216–23. Abstract/FREE Full Text
- Gillies RJ, Raghunand N, Karczmar GS, Bhujwalla ZM. MRI of the tumor microenvironment. J Magn Reson Imaging 2002; 16: 430–50. CrossRefMedline
- Glunde K, Guggino SE, Solaiyappan M, Pathak AP, Ichikawa Y, Bhujwalla ZM. Extracellular acidification alters lysosomal trafficking in human breast cancer cells. Neoplasia 2003; 5: 533–45. Medline
- Martinez-Zaguilan R, Seftor EA, Seftor RE, Chu YW, Gillies RJ, Hendrix MJ. Acidic pH enhances the invasive behavior of human melanoma cells. Clin Exp Metastasis 1996; 14: 176–86. CrossRefMedline
- Rozhin J, Sameni M, Ziegler G, Sloane BF. Pericellular pH affects distribution and secretion of cathepsin B in malignant cells. Cancer Res 1994; 54: 6517–25. Abstract/FREE Full Text
- Rofstad EK, Mathiesen B, Kindem K, Galappathi K. Acidic extracellular pH promotes experimental metastasis of human melanoma cells in athymic nude mice. Cancer Res 2006; 66: 6699–707. Abstract/FREE Full Text
- Schlappack OK, Zimmermann A, Hill RP. Glucose starvation and acidosis: effect on experimental metastatic potential, DNA content and MTX resistance of murine tumour cells. Br J Cancer 1991; 64: 663–70. Medline
- Gatenby RA, Gillies RJ. A microenvironmental model of carcinogenesis. Nat Rev Cancer 2008; 8: 56–61. CrossRefMedline
- Gillies R, Robey IF, Gatenby RA. Causes and consequences of increased glucose consumption in cancers. J Nucl Med 2008; 49: 24–42S. CrossRef
- Raghunand N, He X, van Sluis R, et al. Enhancement of chemotherapy by manipulation of tumour pH. Br J Cancer 1999; 80: 1005–11. CrossRefMedline
- Baggett B, Roy R, Momen S, Morgan S, Tisi L, Morse D, Gillies RJ. Thermostability of firefly luciferases affects efficiency of detection by in vivo bioluminescence. Mol Imaging 2004; 3: 324–32. CrossRefMedline
- Sadikot RT, Jansen ED, Blackwell TR, et al. High-dose dexamethasone accentuates nuclear factor-κB activation in endotoxin-treated mice. Am J Respir Crit Care Med 2001; 164: 873–8. Abstract/FREE Full Text
- Ruoslahti E. How cancer spreads. Sci Am 1996; 275: 72–7. Medline
- Linebaugh BE, Sameni M, Day NA, Sloane BF, Keppler D. Exocytosis of active cathepsin B enzyme activity at pH 7.0, inhibition and molecular mass. Eur J Biochem 1999; 264: 100–9. Medline
- Murata M, Miyashita S, Yokoo C, et al. Novel epoxysuccinyl peptides. Selective inhibitors of cathepsin B, in vitro. FEBS Lett 1991; 280: 307–10. CrossRefMedline
- Freireich EJ, Gehan EA, Rall DP, Schmidt LH, Skipper HE. Quantitative comparison of toxicity of anticancer agents in mouse, rat, hamster, dog, monkey, and man. Cancer Chemother Rep 1966; 50: 219–44. Medline
- Gillies RJ. Intracellular pH and control of proliferation in animal cells. In: Cameron IB, Poole TB, editors. The transformed cell. New York and London: Academic Press; 1981. p. 347–95.
- Pouyssegur J, Franchi A, Pages G. pHi, aerobic glycolysis and vascular endothelial growth factor in tumour growth. Novartis Found Symp 2001; 240: 186–96. Medline
- Gillies RJ, Liu Z, Bhujwalla Z. 31P-MRS measurements of extracellular pH of tumors using 3-aminopropylphosphonate. Am J Physiol 1994; 267: C195–203. Medline
- Gillies RJ, Raghunand N, Garcia-Martin ML, Gatenby RA. pH imaging. A review of pH measurement methods and applications in cancers. IEEE Eng Med Biol Mag 2004; 23: 57–64. Medline
- Silva AS, Yunes JA, Gillies RJ, Gatenby RA. The potential role of systemic buffers in reducing intratumoral extracellular pH and acid-mediated invasion. Cancer Res 2009; 69: 2677–84. Abstract/FREE Full Text
- Galons J-P, Jennings D, Morse D, Gillies RJ. Mechanisms underlying the increase of the apparent diffusion coefficient of water in response to anti-cancer therapy. Israeli J Biochem 2003; 43: 91–101.
- Bockhorn M, Jain RK, Munn LL. Active versus passive mechanisms in metastasis: do cancer cells crawl into vessels, or are they pushed? Lancet Oncol 2007; 8: 444–8. CrossRefMedline
- Fidler IJ. Cancer metastasis. Br Med Bull 1991; 47: 157–77. Abstract/FREE Full Text
- Ishizu K, Sunose N, Yamazaki K, et al. Development and characterization of a model of liver metastasis using human colon cancer HCT-116 cells. Biol Pharm Bull 2007; 30: 1779–83. CrossRefMedline
- Turner GA. Increased release of tumour cells by collagenase at acid pH: a possible mechanism for metastasis. Experientia 1979; 35: 1657–8. CrossRefMedline
- Cuvier C, Jang A, Hill RP. Exposure to hypoxia, glucose starvation and acidosis: effect on invasive capacity of murine tumor cells and correlation with cathepsin (L + B) secretion. Clin Exp Metastasis 1997; 15: 19–25. CrossRefMedline
- Rochefort H. Biological and clinical significance of cathepsin D in breast cancer. Semin Cancer Biol 1990; 1: 153–60. Medline
- Raghunand N, Martinez-Zaguilan R, Wright SH, Gillies RJ. pH and drug resistance. II. Turnover of acidic vesicles and resistance to weakly basic chemotherapeutic drugs. Biochem Pharmacol 1999; 57: 1047–58. CrossRefMedline
- Bourguignon LY, Singleton PA, Diedrich F, Stern R, Gilad E. CD44 interaction with Na+-H+ exchanger (NHE1) creates acidic microenvironments leading to hyaluronidase-2 and cathepsin B activation and breast tumor cell invasion. J Biol Chem 2004; 279: 26991–7007. Abstract/FREE Full Text
- Madan AK, Yu K, Dhurandhar N, Cullinane C, Pang Y, Beech DJ. Association of hyaluronidase and breast adenocarcinoma invasiveness. Oncol Rep 1999; 6: 607–9. Medline
- Stern R, Shuster S, Neudecker BA, Formby B. Lactate stimulates fibroblast expression of hyaluronan and CD44: the Warburg effect revisited. Exp Cell Res 2002; 276: 24–31. CrossRefMedline
- Fukumura D, Xu L, Chen Y, Gohongi T, Seed B, Jain RK. Hypoxia and acidosis independently up-regulate vascular endothelial growth factor transcription in brain tumors in vivo. Cancer Res 2001; 61: 6020–4. Abstract/FREE Full Text
- Shi Q, Le X, Wang B, et al. Regulation of vascular endothelial growth factor expression by acidosis in human cancer cells. Oncogene 2001; 20: 3751–6. CrossRefMedline
- Xu L, Fidler IJ. Acidic pH-induced elevation in interleukin 8 expression by human ovarian carcinoma cells. Cancer Res 2000; 60: 4610–6. Abstract/FREE Full Text
- Park HJ, Lyons JC, Ohtsubo T, Song CW. Acidic environment causes apoptosis by increasing caspase activity. Br J Cancer 1999; 80: 1892–7. CrossRefMedline
- Williams AC, Collard TJ, Paraskeva C. An acidic environment leads to p53 dependent induction of apoptosis in human adenoma and carcinoma cell lines: implications for clonal selection during colorectal carcinogenesis. Oncogene 1999; 18: 3199–204. CrossRefMedline
- Sheridan C, Kishimoto H, Fuchs RK, et al. CD44+/CD24− breast cancer cells exhibit enhanced invasive properties: an early step necessary for metastasis. Breast Cancer Res 2006; 8: R59. CrossRefMedline
- Shipitsin M, Campbell LL, Argani P, et al. Molecular definition of breast tumor heterogeneity. Cancer Cell 2007; 11: 259–73. CrossRefMedline
- Mohamed MM, Sloane BF. Cysteine cathepsins: multifunctional enzymes in cancer. Nat Rev Cancer 2006; 6: 764–75. CrossRefMedline
- Zu XL, Guppy M. Cancer metabolism: facts, fantasy, and fiction. Biochem Biophys Res Commun 2004; 313: 459–65. CrossRefMedline
- Swietach P, Vaughan-Jones RD, Harris AL. Regulation of tumor pH and the role of carbonic anhydrase 9. Cancer Metastasis Rev 2007; 26: 299–310. CrossRefMedline
Click here to see the original study on the NIH PubMed website!
Note: Supplementary data for this article are available at Cancer Research Online (http://cancerres.aacrjournals.org/).
© 2009 American Association for Cancer Research