Home Blog Page 14

Raw Pet Food: Why You Should Feed Jasper Fresh, Raw Food

WARNING
Do not read this article while eating your dinner or feeding your pet!

If you think your pet food really contains healthy ingredients like whole chicken, choice cuts of beef, fresh grains and all the nutrition your dog or cat will ever need … think again!

Raw Pet DogIf you care at all for your beloved pets, please do not believe the ads from the $30 billion/year U.S. pet food industry when it comes to the health of your beloved pets. Rather than being designed scientifically to provide everything your pet needs for good health, as advertised, commercial pet food actually lacks sufficient minerals, enzymes and vitamins for good health – and often contain ingredients, food additives, pesticides and GMO’s actually harmful to pet health. Instead, discover raw pet food!

Basically, the pet food industry is in reality just an extension of the human food industry, and their products are often just as bad as fast food or processed foods — and often much worse! Pet food, from the corporate point of view, is just a place for slaughterhouse waste and grains considered “unfit for human consumption” to be turned into profits!

What you will probably find in commercial pet foods are the contaminated or condemned remains of animals – that means Dead, Dying, Diseased or Disabled livestock. They use absolutely ALL of these waste products, including tongues, esophagi, nails, claws, feathers, beaks, tendons, lungs with pneumonia and other diseased and cancerous meat – nothing goes to waste in the name of profit. You may even find blood and fecal wastes. These are all listed on the label as byproducts which are found in moist as well as dry pet foods.

Those nutritious-sounding “whole grains” used in pet foods are just a cheap filler. In addition to being hard to absorb in a carnivore’s digestive system, these grains are waste products, too, and have had the starch and oil removed for use in other products (usually by chemical processing) or they are the hulls and other remnants from the milling process. Some of the grains used may have been deemed unfit for human consumption because of mold, contaminants or poor storage practices.

Ingredients

12810451 - dog eating carrotThe protein in pet food comes from a variety of sources. When cattle, swine, chickens, lambs, or any number of other animals are slaughtered, the choice cuts such as lean muscle tissue are trimmed away from the carcass for human consumption. Whatever remains of the carcass — bones, blood, pus, intestines, ligaments, and almost all the other parts not generally consumed by humans — is used in pet food.

These “byproducts,” as they’re called on pet food labels, have no legal definition for what is required. Many of these remnants are indigestible and provide a questionable source of nutrition for animals. In addition, the amount of nutrition provided by byproducts can vary from vat to vat.

Another source of meat you won’t find mentioned on pet food labels are dogs and cats that have been put to sleep, dead zoo animals and roadkill. Once it is rendered, Protein is protein – right? Rendering is the process of melting animal carcasses in a huge vat to extract oil, fat, bone meal and meat. The high heat used in rendering is supposed to make all this toxic waste safe – but it doesn’t. Though some bacteria are destroyed initially, there is little attention to paid to the process afterwards, leaving a high probability of contamination later from contact with the raw material. The manufacturers are not required to test for re-contamination. They also don’t test for endotoxins – toxins released from a bacterium when it dies.

What can the feeding of such ingredients do to your companion animal? Some veterinarians claim that feeding slaughterhouse wastes to animals increases their risk of getting cancer and other degenerative diseases. For example, feeding byproducts of dead cows to live cows has been linked to mad cow disease. One factor is that the cooking methods used by pet food manufacturers and rendering plants can’t destroy the hormones used to fatten livestock, or medications, such as those used to treat diseased animals or those used to euthanize dogs and cats.

There is virtually no information on the bio- availability of nutrients…in many of the dietary ingredients used in pet foods. These ingredients are generally byproducts of the meat, poultry and fishing industries, with the potential for a wide variation in nutrient composition. Claims of…the Association of American Feed Control Officials (AAFCO)…do not give assurances of nutritional adequacy …”  –– James Morris, Quinton Rogers, Dept. of Molecular Biosciences, University of California at Davis Veterinary School of Medicine (2008)

Animal & Poultry Fat

You may notice a pungent odor when you open a container of pet food. What is the source of that delightful smell? It is refined animal fat, kitchen grease, and other oils too rancid or deemed inedible for humans, doctored up for the noses of your pets then added to the pet food.

Restaurant grease has been a major component of feed grade animal fat over fifteen years. This grease is held in fifty-gallon drums outside of restaurants for weeks, exposed to extreme temperatures with no regard for its future use. The next few times you dine out, be sure to look out back behind the restaurant for a container with a rendering company’s name on it. It is almost guaranteed that you will find one. Rendering companies pick up this rancid grease and mix the different types of fat together, stabilize them with powerful antioxidants to retard additional spoilage, and then sell the blended products to pet food companies. These fats are sprayed directly onto dried kibble or extruded pellets to make an otherwise bland or distasteful product palatable to your pet. The fat also acts as a binding agent to which manufacturers add other flavor enhancers as well. Pet food scientists have discovered that animals love the taste of these sprayed fats. Manufacturers are masters at getting a dog or a cat to eat something she would normally turn up her nose at.

Wheat, soy, corn, Peanuts Hulls & Other Vegetable Protein

The amount of grain used in pet food has risen over the last decade. Once considered filler by the pet food industry, grain products now make up a considerable portion of pet food. The availability of nutrients in grain products is dependent upon the digestibility of the grain. The amount and type of carbohydrate in pet food determines the amount of nutrient value the animal actually gets. Dogs and cats can almost completely absorb carbohydrates from some grains, such as white rice. Up to 20% of other grains can escape digestion. The availability of nutrients for wheat, beans, and oats is poor. The nutrients in potatoes and corn are far less available than those in rice. Carbohydrate that escapes digestion is of little nutritional value due to bacteria in the colon that ferment carbohydrates. Some ingredients, such as peanut hulls, are used strictly for “filler” and have no nutritional value at all!

Two of the top three ingredients in pet food are almost always some form of grain. But since cats and dogs are carnivores — they must eat meat to fulfill certain physiological needs. Why are we feeding a corn-based product to them? The answer is that corn is cheaper than meat.

In 1995 Nature’s Recipe pulled thousands of tons of dog food off the shelf after consumers complained that their dogs were vomiting and losing their appetite. Nature’s Recipe’s loss amounted to $20 million. The problem was a fungus that produced vomitoxin, an aflatoxin, which is a subset of mycotoxin, a poison given off by mold contaminated the wheat. Although it caused many dogs to vomit, stop eating and have diarrhea, vomitoxin is a milder toxin than most. The more virulent strains of mycotoxins can cause weight loss, liver damage, lameness, and even death. The Nature’s Recipe incident prompted the Food and Drug Administration (FDA) to intervene. Dina Butcher, Agriculture Policy Advisor for North Dakota Governor Ed Schafer, concluded that the discovery of vomitoxin in Nature’s Recipe wasn’t much of a threat to the human population because “the grain that would go into pet food is not a high quality grain. Which means that the grain used in pet food is not fit for human consumption and therefore not a threat to the human population.

Soy is another common ingredient sometimes used as filler in pet food. It adds bulk so that when an animal eats a product containing soy it will feel more satisfied. While soy has been linked to gas in some dogs, other dogs do quite well with it. Vegetarian dog foods use soy as a protein source. Industry critics note that many of the ingredients used as humectants — ingredients such as corn syrup and corn gluten meal which bind water to prevent oxidation — also bind the water in such a way that the food actually sticks to the colon and may cause blockage. The blockage of the colon may cause an increased risk of cancer of the colon or rectum.

Additives & Preservatives

Additives are used in commercial pet foods to improve stability or appearance, and of course provide no nutritional value. These include emulsifiers to prevent water and fat from separating, antioxidants to prevent fat from turning rancid and antimicrobials to reduce spoilage. Added color and flavor make the product more attractive to consumers and their pets.

Two-thirds of the pet food manufactured in the United States contains preservatives. In the remaining third, 90% includes ingredients already stabilized by synthetic preservatives. Premixed vitamin additives used to supplement pet food can also contain preservatives. This means that your pet may eat food with several types of preservatives that have been added at the rendering plant, the manufacturing plant and in the supplemental vitamins.

In the last 40 years, the number of food additives has greatly increased. Of the more than 8,600 recognized food additives today, no toxicity information is available for 46% of them. Cancer-causing agents are sometimes permitted if they are used at low enough levels. The risk of continued use at these cancer-causing agents has not been studied and the build up of these agents may be harmful. Ethoxyquin (EQ), for example, was found in dogs’ livers and tissues months after it had been removed from their diet, and as of July 31, 1997, the FDA’s Center for Veterinary Medicine requested that manufacturers reduce the maximum level for EQ be cut in half, to 75 parts per million.

Though the law requires studies of direct toxicity of additives and preservatives, most of them have not been tested for their combined effect after ingestion. Three commonly used preservatives, BHA, BHT, and EQ, have a proven synergistic effect that may lead to the development of certain types of cancer. Butylated hydroxyanisole (BHA) and butylated hydroxtoluene (BHT) are the most commonly used antioxidants in processed food for human consumption. For these antioxidants, there is little information documenting their toxicity or the safety of long-term use in pet food.

In animal feeds, the most commonly used antioxidant preservative is ethoxyquin. Some pet food critics and veterinarians claim ethoxyquin is a major cause of disease, skin problems, and infertility in dogs. Ethoxyquin is not approved for use as a preservative in human food.

Nitrate, also used in meat for human consumption. combines with bacteria, which changes it to another chemical form with carcinogenic properties called nitrosamines. Very small amounts of this chemical can cause acute and chronic liver damage.

“Natural preservatives” and antioxidants are like Vitamin C, Vitamin E, may seem better than chemical preservatives they may be less effective than chemical preservatives.

To make pet food nutritious, manufacturers “fortify” it with vitamins and minerals, which are also just more highly processed, hard to digest chemicals. They have to do this, however, because the other ingredients in the pet food basically have little or no nutrition left after processing.

The answer, of course, is to use fresh, whole raw foods that don’t need preservatives, that aren’t rancid and rendered, that aren’t made from by -products, and that are too disgusting to discuss during dinner!

Contaminants

Commercially manufactured or rendered meat meals are highly contaminated with bacteria because their source includes animals that have died because of disease, injury, or natural causes. These dead animal may not be rendered until days after death. Therefore the carcass is often contaminated with bacteria. While cooking may kill bacteria, it does not eliminate endotoxins that can cause disease. Pet food manufacturers do not test their products for endotoxins.

Escherichia coli (E Coli) is another bacteria that can be found in contaminated pet foods. E Coli bacteria, like Salmonella, can be destroyed by cooking at high temperatures, however, the endotoxin produced by the bacteria will remain.

Aflatoxin comes from mold or fungi. Improper drying and storage of crops causes mold growth, which results in Aflatoxin contamination. Ingredients that are most likely to be contaminated with this toxin are cottonseed meal, peanut meal, and fish meal.

Labeling

The National Research Council (NRC) of the Academy of Sciences set the nutritional standards for pet food until 1974, when the pet food industry created a group called the American Association of Feed Control Officials (AAFCO). At that time AAFCO chose to adopt the NRC standards rather than develop its own. The NRC standards required feeding trials for pet foods that claimed to be “complete” and “balanced.” The pet food industry found the feeding trials to be too restrictive, so AAFCO designed an alternate procedure for claiming the nutritional adequacy of pet food. Instead of feeding trials, chemical analysis would be done to determine if a food met or exceeded the NRC standards. But chemical analysis does not address the palatability, digestibility and biological availability of nutrients in pet food. So it is unreliable for determining whether a food will provide an animal with sufficient nutrition. To compensate for the limitations of chemical analysis, AAFCO added a “safety factor,” which was to exceed the minimum amount of nutrients required to meet the complete and balanced requirements. By establishing its own standards and disregarding the NRC standards, AAFCO established itself as the governing body for pet food. In essence the pet food industry developed its own standards for nutritional adequacy.

Genetically Modified Ingredients (GMOs)

Most pet foods on the market today are probably mostly made from corn products that are genetically modified (GMO) — the seeds genetically modified to produce plants that can withstand repeated spraying with Monsanto’s Roundup, a glyphosate-based weed killer demonstrated to have adverse health effects in animals!

Today, more than 90% of the corn grown in in the U.S. is genetically modified. Studies have shown that genetically modified corn causes significant kidney and liver disease in rats after only a 90-day feeding trial, and has a negative effect on the heart, spleen and other organs. A new lifetime study of rats fed GMO corn shows they died earlier than rats on a standard diet plus they developed tumors and severe kidney and liver damage as well. Half the male rats and 70 percent of females died prematurely, compared with 30 percent of males and 20 percent of females in the control group.

A 2009 article in the journal Critical Reviews in Food Science and Nutrition asserted that “The results of most of the rather few studies conducted with GM foods indicate that they may cause hepatic, pancreatic, renal, and reproductive effects and may alter hematological, biochemical, and immunologic parameters the significance of which remains unknown. The above results indicate that many GM foods have some common toxic effects.

The toxic insecticidal agent Bacillus thuringiensis is present in most GMO crops in the U.S. that wind up in animal feed and pet food. Glufosinate and glyphosate are herbicides, applied to millions of acres of genetically modified crops in the U.S. These herbicides cause kidney damage in animals, endocrine disruption and birth defects in frogs, and are lethal to many amphibians. Glyphosate has also been linked to miscarriages, premature births, and non-Hodgkin’s lymphoma, in humans.

Health experts are connecting the rise in human allergies, including skin conditions and inflammatory GI disorders, to consumption of GMO foods – in particular, GMO soy

Independent animal feeding safety studies show adverse or unexplained effects of GMO foods, including inflammation and abnormal cell growth in the GI tract, as well as in the liver, kidney, testicles, heart, pancreas and brain. GMO crops have also been shown to be unstable and prone to unplanned mutations.

Also, remember that corn and soy ingredients are not biologically appropriate for dogs dog and cats, even if they’re not GMO. Both these ingredients are associated with a variety of health problems in animals, from allergies and skin disorders to oral disease, inflammatory bowel disease,and cystitis.

Problems Caused by Inadequate Nutrition in Pet Foods

The idea of one pet food providing 100% of a pet’s nutrition for its entire life is a myth. Since cereals are the primary ingredients in most commercial pet foods, and dogs and cats eat need protein and variety, commercial pet foods can’t provide adequate nutrition. The problems associated with a commercial diet are seen every day at veterinary establishments. Chronic digestive problems, such as chronic diarrhea, are among the most frequent illnesses treated. Allergy or hypersensitivity to foods is a common problem usually seen as diarrhea or vomiting. The market for “hypoallergenic” pet foods is now a multi-million dollar business. These diets were formulated to address the increasing intolerance to foods that animals have developed to commercial pet foods.

Even the actual meat that is used in commercial pet foods has poor protein digestibility. Diets containing protein with less than 70% digestibility cause diarrhea in dogs. Some fillers used in these foods can also cause colitis, which is the inflammation of the colon. Most pet food companies do not publish digestibility statistics and they are never seen on pet food labels. Acute vomiting and diarrhea is also a symptom of bacteria contamination. Dry commercial food is often contaminated with bacteria which may cause problems. Improper food storage and some feeding practices may result in the multiplication of this bacteria. For example, adding water to moisten pet food and then leaving it at room temperature causes bacteria to multiply. Yet this practice is suggested on the back of some kitten and puppy foods.

Pet food formulas and the practice of feeding that manufacturers recommend have increased other digestive problems. Feeding only one meal per day can cause the irritation of the esophagus by stomach acid. Feeding two smaller meals is better. Urinary tract disease is directly related to diet in both cats and dogs. Plugs, crystals, and stones in cat bladders are caused by commercial pet food formulas.  Dogs can also form stones as a result of their diet.

Rapid growth in large breed puppies has been shown to contribute to bone and joint disease. Excess calories in manufactured puppy food formulas promote rapid growth. There are now special puppy foods for large breed dogs. But this recent change will not help the countless dogs who lived and died with hip and elbow disease.

There is also evidence that hyperthyroidism in cats results from commercial pet food diets. This is a new disease that first surfaced in the 1970s, when canned food products first came on the market. The exact cause and effect are not yet known. This is a serious and sometimes terminal disease and treatment is expensive.

Many nutritional problems appeared with the popularity of cereal-based commercial pet foods. Sometimes this is because the diet is incomplete. Sometimes it’s a result of additives or a result of contamination with bacteria, toxins and other organisms. In some diseases the role of commercial pet food is understood, in others, it is not. The bottom line is that diets composed primarily of low quality cereals and rendered meat meals are not as nutritious or safe as you should expect for your cat or dog.

Are your pets eating food industry waste?

We’re often able to deceive ourselves into believing pet foods are good for dogs and cats is because the changes to a pet’s health and vitality brought on by a dead, processed, chemically-laden diet are usually not acute nor immediate. For half-century our pets have been fed inappropriate diets that have kept them alive — but not thriving. In fact, we’ve created several generations of pets that suffer from a variety of degenerative diseases we think come from age but are actually linked to nutritional deficiencies.

To multi-national food companies, a pet food company is just a marketing strategy for turning their waste products and garbage into profits. The pet food consumer is shown glossy pictures of choice cuts of meat and fresh vegetables on the pet food label…but what guarantee is the consumer given that those labels are truthful, honest depictions of the ingredients used in the pet food?  None.

The purchase and use of these ingredients by the pet food industry not only provides nutritional needs for pets at reasonable costs, but provides an important source of income to American farmers and processors of meat, poultry and seafood products for human consumption.
The Pet Food Institute on the use of by-products (i.e., waste)
as extra income for producers and farmers

Secret Ingredients

Of the top 4 ingredients in Purina O.N.E. Dog Formula (Chicken, Ground Yellow Corn, Ground Wheat, and Corn Gluten Meal) 2 are corn-based products … the same product. This industry practice is known as splitting. When components of the same whole ingredients are listed separately — such as Ground Yellow Corn and Corn Gluten Meal — it appears there is less corn than chicken, even though the combined corn ingredients outweigh the chicken.

The answer for feeding your beloved pets is the same as it is for the rest of your family – whole, live, fresh raw food! And thankfully, it isn’t as difficult as you may think. This web site provides some recipes and links to other raw pet food web pages. Just take a dash of your love for your pet and mix it thoroughly with a little online research and you’re on your way!

Additives Commonly Found in Commercial Pet Foods
  • Anticaking agents
  • Lubricants
  • Antimicrobial agents
  • Non-nutritive sweeteners
  • Antioxidants
  • Nutritive sweeteners
  • Coloring agents
  • Oxidizing, reducing agents
  • Curing agents
  • pH control agents
  • Drying agents
  • Processing aids
  • Emulsifiers
  • Sequestrants
  • Firming agents
  • Solvents, vehicles
  • Flavor enhancers
  • Stabilizers, thickeners
  • Flavoring agents
  • Surface active agents
  • Flour treating agents
  • Surface finishing agents
  • Formulation aids
  • Synergists
  • Humectants
  • Texturizers
  • Leavening agents
Suggested References
  • American Pet Products Association.
  • http://www.americanpetproducts.org/press_industrytrends.asp
  • Animal Protection Institute. “What’s Really in Pet Food.” 05/01/2007.
  • http://www.bornfreeusa.org/facts.php?more=1&p=359
  • Consumer Search. “Cat Food: Full Report.” 02/01/2009.
  • http://www.consumersearch.com/cat-food/review
  • Consumer Search. “Dog Food: Full Report.” 02/01/2009.
  • http://www.consumersearch.com/dog-food/dog-food-ingredients
  • Dunn Jr., Dr. TJ. “Basic Nutrition for Dogs.” Dog World Magazine. 09/15/2009.
  • http://www.thepetcenter.com/article.aspx?id=3406
  • De La Cruz, Dr. Keith. “Feed Your Dog Right.” Business Mirror. 03/07/2010.
  • http://businessmirror.com.ph/index.php?option=com_content&view=article&id=22644:feed-your-dog-right&catid=32:life&Itemid=68
  • The Humane Society of the United States. “U.S. Pet Ownership Statistics.” 12/30/2009.
  • http://www.humanesociety.org/issues/pet_overpopulation/facts/pet_ownership_statistics.html
  • Nash, Holly. “Dog Food Standards by the AAFCO.”
  • http://www.peteducation.com/article.cfm?c=2+1659+1661&aid=662
  • Newman, Lisa. “What’s in Your Pet’s Food?” Purely Pets. 06/24/2009.
  • http://www.purelypets.com/articles/whatsinfood.htm
  • Phillips-Donaldson, Debbie. “Something to chew on: Petfood still growing.” Petfood Industry. 12/18/2009.
  • http://www.petfoodindustry.com/stillgrowing0912.aspx

Originally written by Robert Ross  in 2010, updated April 2017.

Also read:

Why We Really Don’t Need GMO Foods

The Benefits of Raw Food – Robert’s Raw Food Videos in West Palm Beach, FL

soma cafe palm beachHere are some raw food videos of talks I gave at the Soma Cafe in Florida about the benefits of a raw food lifestyle, how raw food actually can change your consciousness, how cooked food is addictive and how it causes disease. I always approach raw food with the basic premise that food is our medicine. Experience the raw vegan diet for yourself and you’ll also start to enjoy a vibrant new connection with your food, as well as the the role you play on our planet. The impact of this will awaken something inside you that’s been suppressed by a diet fill with mind numbing toxins. So enjoy!

Everyone can have this transformational experience by thinking about your diet and in totally new ways — and committing to a healthier, cleaner, toxin-free lifestyle. Remember, you are what you eat. So your food is the most direct connection you will ever have to your world, more than even the air you breathe.

Raw Food Video #1
I talk about how raw food restores the cell’s normal sugar metabolism and how an abnormal, anaerobic sugar metabolism for the cell causes cooked food addictions and dis-ease.

Raw Food Video #2
I talk about digestion and energy, transit times, autointoxication and more – with a couple of rants about quantum biology and the Whole Foods scam of “California” Medley frozen organic veggies made in China!

Raw Food Video #3
I rant a bit about the environmental impact & dangers of organic products that come from china, plastic water bottles, genetically modified foods, global warming and much more.

Raw Food Video #4
I rant a bit more about environmental issues, why I teach, how raw food changes consciousness and creates miracles in my life, my struggle to stay raw, high fructose corn syrup, sugar metabolism and more.

Also Watch:

Interview with Robert Ross

The Raw Truth: What You Probably Don’t Know About Agave Nectar

If you are reading this article you probably already know the truth about agave and avoid foods containing High Fructose Corn Syrup (HFCS). But just as John Q. Public is learning that this is actually very bad for you, the commercial food industry has discovered something even better to fool us with — and it’s targeted right at the health-conscious consumer! Welcome to the world of agave nectar — a diabetic friendly, raw, and 100% natural sweetener. Except that’s completely UNTRUE!

High Fructose Corn Syrup Is Bad for You!

Today, agave nectar is found in the health food aisles of many supermarkets. It’s also be found as an ingredient in many foods labeled organic or even raw, from ketchup and ice cream to chocolate and healthy snacks. The labels on these products are designed to make you think that agave is a natural unrefined sweetener that has been used by indigenous peoples in Mexico for thousands of years — but that’s just a sad joke given the actual history of agave.

While it is true that a long time ago in Mexico they used the sweet sap from the Pina (top  of the plant), the agave nectar in stores today is a relative newcomer to the world of artificial sweeteners actually invented during the 1990’s. The “Blue Agave” that you find  in stores now isn’t even made from the sap or nectar of a real agave plant, as the original white agave was. Instead, Blue Agave is processed by removing the root or bulb of the plant, then treating it with chemicals and processing beyond all recognition!

The traditional Agave Salmiana (White Agave) associated with health benefits is made much more naturally — and tediously. It is very rare today.  Agave Salmiana grows a flower from the center of the plant called the Quiote.  The Quiote is cut off when the plants is 7-8 years old, creating a hole or pool of liquid in the center of the plant, called “Aguamiel.”  The plant is then milked twice daily as the Aguamiel collects.

Aguamiel is not the “sap” of the leaves as is some commercial sources like to claim. In fact, the sap from the leaves is actually inedible — containing saponins, raphides and calcium oxalate.  Aguamiel is the juice that the plant makes to feed the Quiote, so is full of nutrients like carbohydrates, fructans, vitamins and amino acids. The removal of the water in the Aquamile juice leaves White Agave nectar — the healthy, traditional agave that’s almost impossible to find and very expensive. Even if you do locate some, it still has far  too much fructose for most people. It is also quite acid-forming for your body.

Diabetes Disaster

Because high fructose agave syrup won’t spike blood glucose levels, some ruthless companies promote agave syrup as a good alternative for diabetics! For this they should probably be criminally prosecuted!  Of course fructose doesn’t trigger a test for glucose – but that doesn’t actually make it a healthy substitute even for diabetics!  Unlike glucose, which is metabolized by the pancreas, fructose is metabolized by the liver just like alcohol and produces many of the same side effects as chronic alcoholism! That can include mineral depletion, liver inflammation, hardening of the arteries, insulin resistance & diabetes, high blood pressure, cardiovascular disease, obesity, stroke, cancer, arthritis and premature aging.

Yucca plants also contain saponins – highly toxic steroid derivatives. Yet this nasty, unscrupulous industry actually tries to claim that saponins have some ridiculous health benefits,. However, you should avoid them at all costs, especially if pregnant or breastfeeding!

If you have any insulin-related issues like high blood pressure, high cholesterol, diabetes or overweight problems, I suggestions you avoid all sweeteners, including fructose or agave. I even limit my use of Stevia, a natural sugar substitute. As a raw foodist I believe its far better to rehabilitate your ability to enjoy the natural goodness in unadulterated foods without adding any sweeteners. That will empowers your innate ability to eat “intuitively.”

If you want something sweet, eat a piece of fruit. Even raw organic snack bars are loaded with processed sugars. I say that because even drying fruit in the sun is actually a form of processing! Dried fruits are sources of highly concentrated sugars and can be almost as bad as any other kind of sugar.

Now, of course that is an ideal. You might have to work up to it, since most people are addicted to everything tasting sweeter than it really needs to. Also, your body may have adapted to an emergency form of cellular metabolism that relies more on glucose, since that is all you have been eating for decades.

Instead, here are a few alternatives — though eliminating your need for sweet things is really the best long term strategy. Until then, for raw dishes try using raw honey or dates. For cooked dishes try organic maple syrup. For an occasional desert use dehydrated cane sugar juice or maple sugar in moderation. Freshly made apple juice or orange juice can also provide plenty of sweetness – but remember, juicing sweet fruits is also a form of processing that concentrates sugars so should be used in moderation. If you must use agave, look for traditional raw, organic agave if you can find it.

But here is the bottom line — ultimately all sweeteners are bad and acidic-forming to your body just like cooked food. Healthy food actually taste wonderfully naturally once you are used to the natural taste of food. When you alter the way foods taste you actually confuse your ability to know “intuitively” what’s good and what’s not. With a raw, live food diet, after a period of cleansing and healing at the cellular level, your natural ability to taste real food begins to return. That’s when live, fresh foods begin to taste wonderful without any enhancement. After that, if you have a craving its no longer your addictions calling, it means your body actually has a real nutritionally need.

The Raw Food Answer – No Processing, No Labels, No Lies

When you eat fresh, organic raw food it doesn’t come with fine print on the label that can be distorted and twisted by greed. Every single new sweetener like agave syrup introduced into the market was invented to do one thing – make a profit for a corporation. Since the FDA doesn’t enforce food-labeling laws, you can’t be sure what you’re eating is what is on the label of any processed food. So please, just don’t eat that junk!

Reduce Your Consumption of Fructose and ALL artificial sweeteners!


Selected References

  • Morell SF and Nagel R. “Agave nectar: Worse than we thought,” April 30, 2009. Weston A. Price Foundation
  • US Patent 5846333—Method of producing fructose syrup from agave plants
  •  Carr C. “Agave’s sweet spot,” January 31, 2009, Time Magazine
  • “Heat forms potentially harmful substance in high-fructose corn syrup,
    bee study finds,” ScienceDaily August 27, 2009
  • LeBlanc BW, Eggleston G, Sammatarot D, , et al,. “Formation of hydroxymethylfurfural in domestic high-fructose corn syrup and its toxicity to the honey bee,” J. Agric. Food Chem., 2009, 57(16), pp 7369-7376

Also read:

The 2nd Most Important Molecule in Your Body – Say Hello to ATP!

Raw Guide for People Who Hate Vegetables

Why some people hate vegetables and what can they do about it.

In today’s fast-food society, it’s not  uncommon for people to have an aversion to vegetables — actually, they hate vegetables! Of course, this can make becoming a vegetarian, vegan, worse, a raw foodist a little daunting. When I became a vegetarian 40 years ago, people thought I was very strange. Now, after 40 years, being a vegan or vegetarian diet is at least considered healthy, even if a little unusual. It took 4 decades for me just to get to where people at least accept being vegan or vegetarian as a somewhat reasonable idea.

Now we areI Hate Vegetables asking people to accept not just eating mostly vegetables as a way of life, but actually eating them raw! For some people that’s much more than just hard to accept – many people just won’t even try them. They just hate vegetables!

According to the U.S. CDC, about 75% of Americans don’t eat the recommended five to nine servings of fresh fruits and vegetables per day. That’s alarming, considering how important vegetables are to maintaining a healthy and productive lifestyle — but not surprising, given that some people think that ketchup counts as one serving of vegetables!

So when you get to a buffet do you choose the chocolate cake over the carrot sticks even though you know carrot sticks are healthier? Do you skip the salad at the restaurant? Does the idea of eating something green make you gag? Well, many people new to raw food are confronting just such a challenge! They didn’t get interested in the raw food lifestyle merely because they thought it’s delicious – they were overweight or they got sick. Usually that is how they got here – raw food may have been their last resort. They studied raw nutrition, they’ve read stories about people who’ve overcome the very dis-ease they are struggling with using a raw food diet – but it didn’t help. Veggies still make them gag.

If vegetables weren’t good for you, you could simply eliminate them from your diet without any consequences. But in fact, that is what most people in our so-called civilization have done – and it has led to a society with more health problems than ever – from rampant obesity and diabetes to epidemic of cancer and heart disease. So how did we get here? How did we turn our natural taste for things that are good for us, which we evolved with, into an addiction to things that are bad for us – and even an aversion to the good stuff?

The answer is money. Over the last 100 years or so we surrendered our responsibility for what we eat into the hands of big business. In effect, we surrendered the responsibility for our nutrition into the hands of corporations who are legally obligated to put profit before nutrition – so they did. Now we can buy a whole fast food meal for $1.99. Maybe even less – I’m not sure since I haven’t been to a fast food joint in 30 years.

I believe that big business, in their never-ending “fiduciary responsibility” to the Gods of Profit, spent the last 100 years developing various ways to sell more of their products, reduce their costs and increase their profits – at any cost! The results is a testament to the effectiveness of their efforts – people are addicted to artificial preservatives, sweeteners, genetically modified foods and more to such an extent that the delicious natural taste of vegetables now makes them gag! Big business has evolved a new breed of human being, one that with the help of modern pharmaceuticals can manage to survive to a ripe old age without ever eating anything that is truly healthy.

One of the main culprits is sugar. In fact, if you really do hate vegetables, don’t blame the veggies — you are probably just addicted to sugar. Today there is some sort of sweetener in absolutely every single foodI Hate Vegetables, Too that is commercially prepared. It’s not just cane sugar, since we all know to avoid that, it is all the sweeteners – some with innocuous names you don’t even know mean “sugar”! One of the worst is “high fructose corn syrup” (HFCS). “Corn? How bad can that be?” you ask. Well, it’s very bad actually, since HFCS today comes from a variety of genetically engineered corn that isn’t even edible by humans any more! This isn’t the “corn” you think about when you go to the supermarket – it’s designed for motor vehicle fuel and sugar production, and is even sweeter than regular sugar!

This innocuous-sounding product has been linked to obesity and type 2 diabetes and has become perhaps the leading source of added sugar in our diet. There is some kind of sweetener in things that don’t even taste sweet. What’s that about? It is all about creating an addiction … because addicts are the best customers of all. And now that your taste for sweets has been properly programmed, the natural taste of nutrient dense organic vegetables won’t satisfy your sweet tooth. In fact, because they are very “alkaline forming,” they may initially taste bitter or nasty to you — and so you may actually hate vegetables. However, veggies are really not bitter at all, but without all the sugar that you’re addicted to these days you may think they are. The healthier the veggie the worse it tastes! So what are you to do?

Here are 12 raw food strategies for people who hate vegetables:

1. Make a commitment to change
To start out, you have to make a decision or commitment to change. You’ll need to accept that it will be difficult at first, so the first thing you have to change is the way you think about vegetables before you eat them. If you look at a veggie and think, “this is awful,” before it even gets in your mouth, you are not going to like it no matter what you do. You need to discard that initial reaction to your veggies. If you can do that, you can re-train your taste buds.

2. Re-train Your Taste Buds.

I Hate Vegetables

We evolved over millions of years to enjoy the taste of foods that are good for us. It took less than a century for big business to retrain our taste buds to prefer things that are bad for us. They did that by making bad things taste like good things. Many good foods have a little sugar in them. There is nothing wrong with that. Lots of good healthy foods have a little MSG in them.

Yeah … it’s true. Our taste buds evolved so you would like a little MSG. Then big business decided to make artificial MSG that they could add to their empty-calorie foods so you would like those better. The good news is that natural foods are where the artificial sweeteners and “flavor enhancers” got their inspiration in the first place! So it is not all that hard to learn to enjoy them. Your taste buds aren’t broken, they just need to be retrained. By weaning yourself off of the things that confuse your taste buds, like artificial flavors and sweeteners, they can begin to return to normal – and eventually actually develop the ability to taste – and enjoy – the natural nutrition in the foods you put in your mouth!

3. Why all Vegetables are Not Created Equal.

Which veggies look more alive and healthy to you?
Fresh, Living Vegetables
Canned Supermarket Vegetable

When I was just a kid I really thought I hated vegetables. I didn’t actually hate vegetables at all, but I really, really hated those awful mushy, nasty things Mom pulled out of the freezer or dumped from a can onto my plate. Then I discovered that those nasty things weren’t real vegetables at all -– they’re something else, a shadow of their former selves.

You see, when you overcook, freeze, genetically engineer and otherwise “improve” a vegetable it becomes something else. It isn’t truly a “vegetable” any more – really! It actually has been chemically changed by cooking and processing to the point that it certainly isn’t food any  longer. It doesn’t taste like real food (once you re-learn what real food tastes like, that is). In fact, it doesn’t even taste good without a lot of salt and artificial (or so called “natural”) flavorings that aren’t good for you either. On the other hand, fresh organic nutrient-dense vegetables taste wonderful, even with nothing on them! I love just plain broccoli or cauliflower. A carrot is like dessert. Avocados – yum!

But take a plastic bag of frozen broccoli, peas and cauliflower, boil it into a limp slimy green mess until it stinks like rotting garbage, slop a ton of margarine and salt on top to hide the taste (doesn’t help the smell though) – and no wonder you hate vegetables! If you had to cope with that when growing up, you’ve been scarred for life! So to change that pattern, you need to realize that the taste of a vegetable changes drastically depending on how it’s cooked –- or in my case, NOT cooked! The taste of raw organic veggies is wonderful to me now, and it will be to you. I promise! To ease your transition, you can try lightly steaming your veggies, or lightly cooking them with a minimum of organic olive oil in a wok.

4. Stick with your program.
In this age of processed foods and sugar-addictions, the poor vegetable can’t possibly have the appeal of a chemically-processed burger that’s been field-tested by marketing and psychology experts who know all your buttons. Making a transition to real, organic, whole food isn’t going to happen overnight. So once you get past your initial disappointment in your vegetables, keep eating them anyway. Eventually, you’ll begin to appreciate them, and then even really desire them. But you must stick with the program. Don’t give up just because that pizza is still calling to you. But if you can’t stand it any more, go ahead and have a slice! Sometimes you have to treat yourself compassionately – don’t give in easily, but don’t make it such a burden that you resent what you are trying to achieve and stop altogether. After the pizza, topped with veggies perhaps, you can get back on the horse and keep on riding.

5. Eat your veggies with other foods.
When you get started, try masking the initial taste of vegetables. A salad dressing you like will make your salad go down easier. I used to get “salad pizza” at my favorite pizza place – a big delicious fresh salad right on top of a slice! Mix toasted almonds or sesame seeds in with your vegetable dish. If you are used to salty things, get some dulse flakes at your local health food store and sprinkle those on instead – or mix in any sea vegetables with your fresh veggies.

6. Drink your veggies!
Juice bars are popping up all over, providing a fresh, tasty alternative to eating vegetables. Keep in mind that even fresh juices are powerful, concentrated foods, and some commercial juice bars include additives like sugar, flavorings or even dairy products. Juiced veggies also don’t have the fiber you get from their whole counterparts. I always tell people to “chew your juices and drink your solids.” You see, digestion starts in the mouth, so for optimum digestion you want to chew solids enough to liquefy them and “chew” liquids to mix them with the enzymes in your saliva. Even more convenient is to get a juicer for your home. I recommend the Green Star Elite, a twin-gear masticating juicer that I use myself. It is the best bang for the buck because it does everything, including wheatgrass, has a slow-speed 80 RPM motor, reducing heat and oxidation for optimum nutrition, and cleans up in just a few minutes.

7. Transform your veggies into sauces, soups, toppings and garnishes.
Tomato sauce, some salad dressings, and salsas are just a few of the recipes you can find for making vegetables more palatable. You can even make delicious raw soups. My books have plenty of recipes. Mix vegetables with ginger, Braggs Amino’s (used sparingly), apple cider vinegar, and sesame oil to make a healthy salad dressing. Half a cup equals one whole vegetable serving. Hate vegetables? If not 100% raw yet, you can add your veggies to other dishes. Top a pizza with fresh broccoli or cauliflower – don’t knock it til you try it! Just crumble up or finely dice the tops first then sprinkle them right on the pizza. Of course, there’s also spinach, mushrooms and peppers, but use them RAW! Toss some fresh sprouts and tomato slices on top for delicious pizza, or add them to any kind of sandwich.

8. Try Something You Haven’t Had Before
Many people hate vegetables because they’ve never tried anything other than peas and carrots. Try something new — you never know what you may discover. Sure, you’re bored with tomatoes, potatoes and iceberg lettuce — so give eggplant or arugula a try! All have very different textures and flavors and are full of nutrients. Ask your local grocer for recommendations or check out the recipes in one of my e-books.

9. Stick with Raw
Many raw vegetables make great snacks just by adding hummus, salad dressings and salsa. Keep them ready for quick easy access by cleaning them when you get back from the store. Cut them into bite size bits and store in the green bags you can get at health food stores. I keep them at eye level in my refrigerator so I see them first whenever I get the munchies. Broccoli, cauliflower and carrots go well with just about anything, and organic baby tomatoes can be eaten just by themselves.

10. Eat from the Rainbow
When you think about vegetables, you probably think green. But vegetables come in a wide variety of colors, from red to purple, yellow to orange. Each color brings a whole new set of vitamins, minerals and flavors to your table.

11. Eat Seasonally
Fresh, in-season, locally grown vegetables offer the most flavor and nutrition. For example, asparagus is ideal in the spring. Arugula, corn and tomatoes are best in the summer. Broccoli, eggplant and pumpkins reach their peak in the fall, Many green veggies are best in the winter.

12. Grow them yourself.
Try growing some vegetables in your own organic garden. It’s very hard not to like vegetables that you grew yourself. In the end, you may find out that you actually don’t hate vegetables, you just hate them prepared in the ways you’ve always tried them. So give some new recipes a try and eat them raw! I suspect you will surprise yourself.

Also Read:

Raw Food Basics — How to Enjoy a Raw Food Lifestyle

Bicarbonates neutralize the acid toxins prevalent in cooked foods.

Your whole body is based on a careful balance between acid and alkaline. In fact your life depends on it! So the body has several systems to make bicarbonates to neutralize the acid toxins prevalent in a cooked food lifestyle. This study helps support that.

Bicarbonate Increases Tumor pH and Inhibits Spontaneous Metastases
Published Online, March 10, 2009; doi: 10.1158/0008-5472.CAN-07-5575 Cancer Res March 15, 2009 69; 2260

Abstract

Journal of Cancer Research
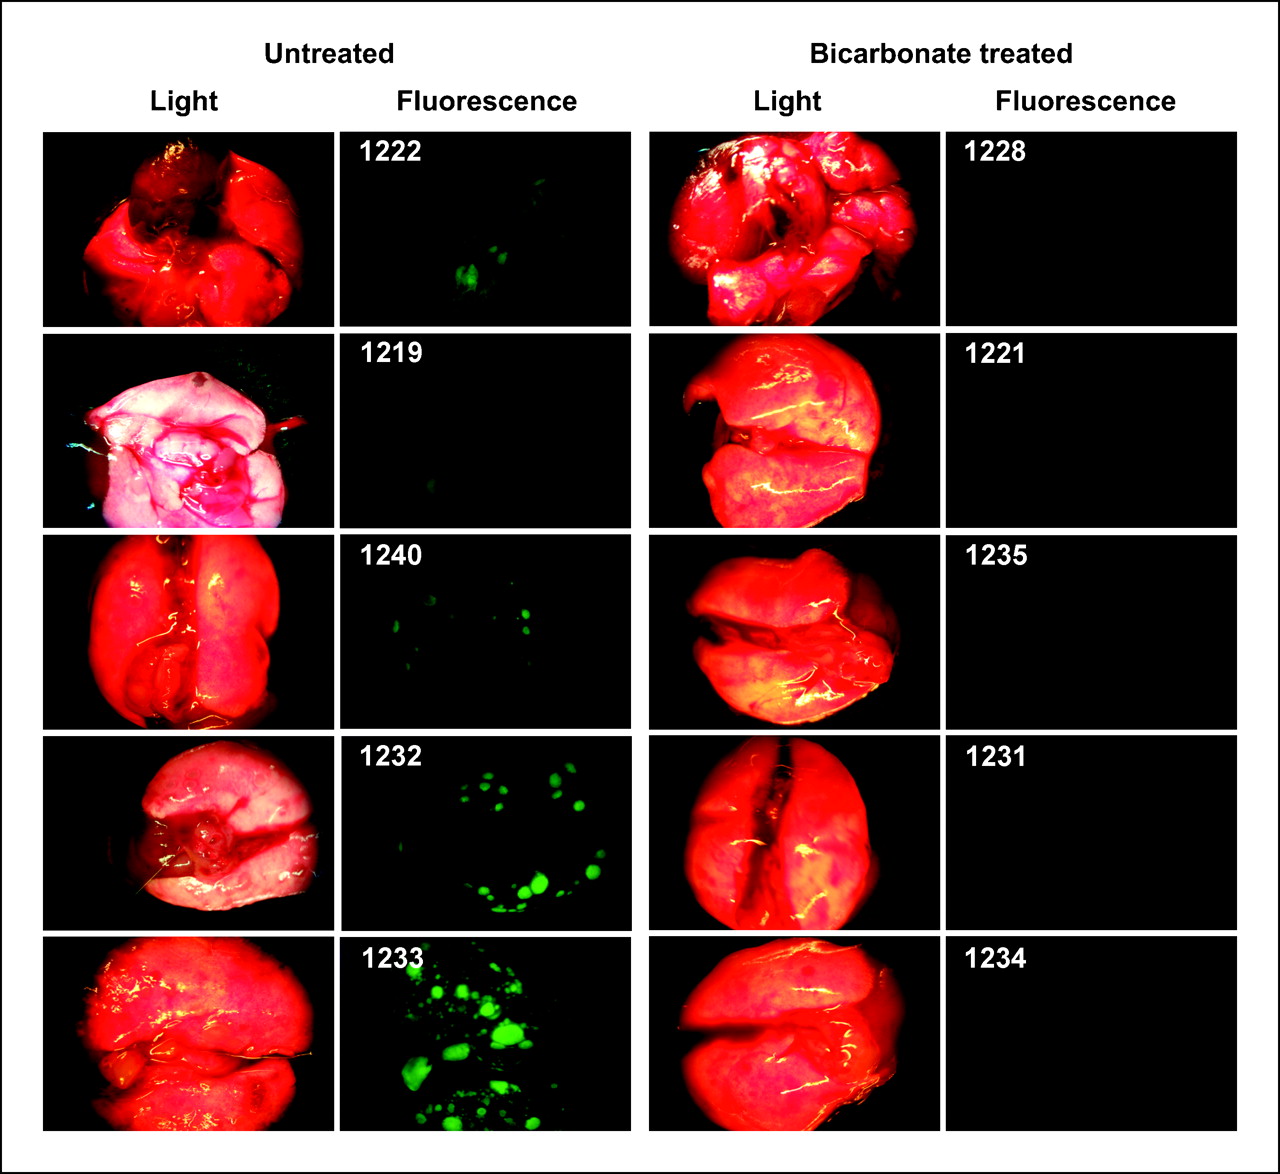
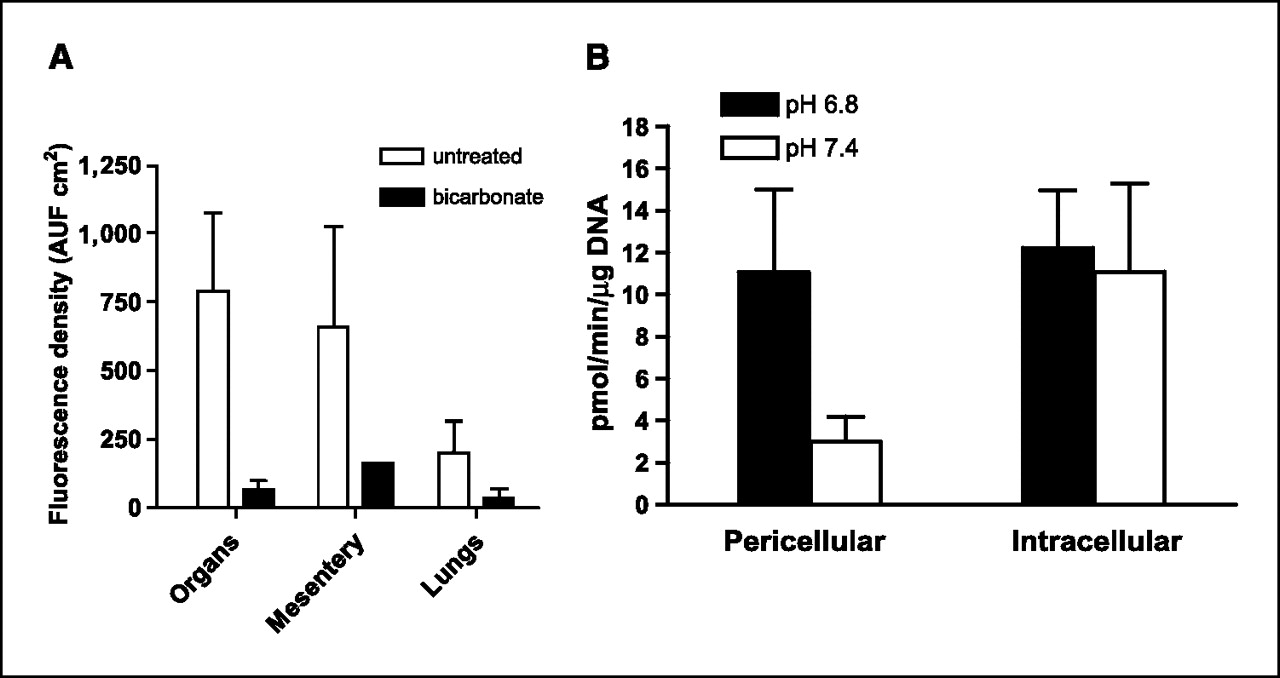
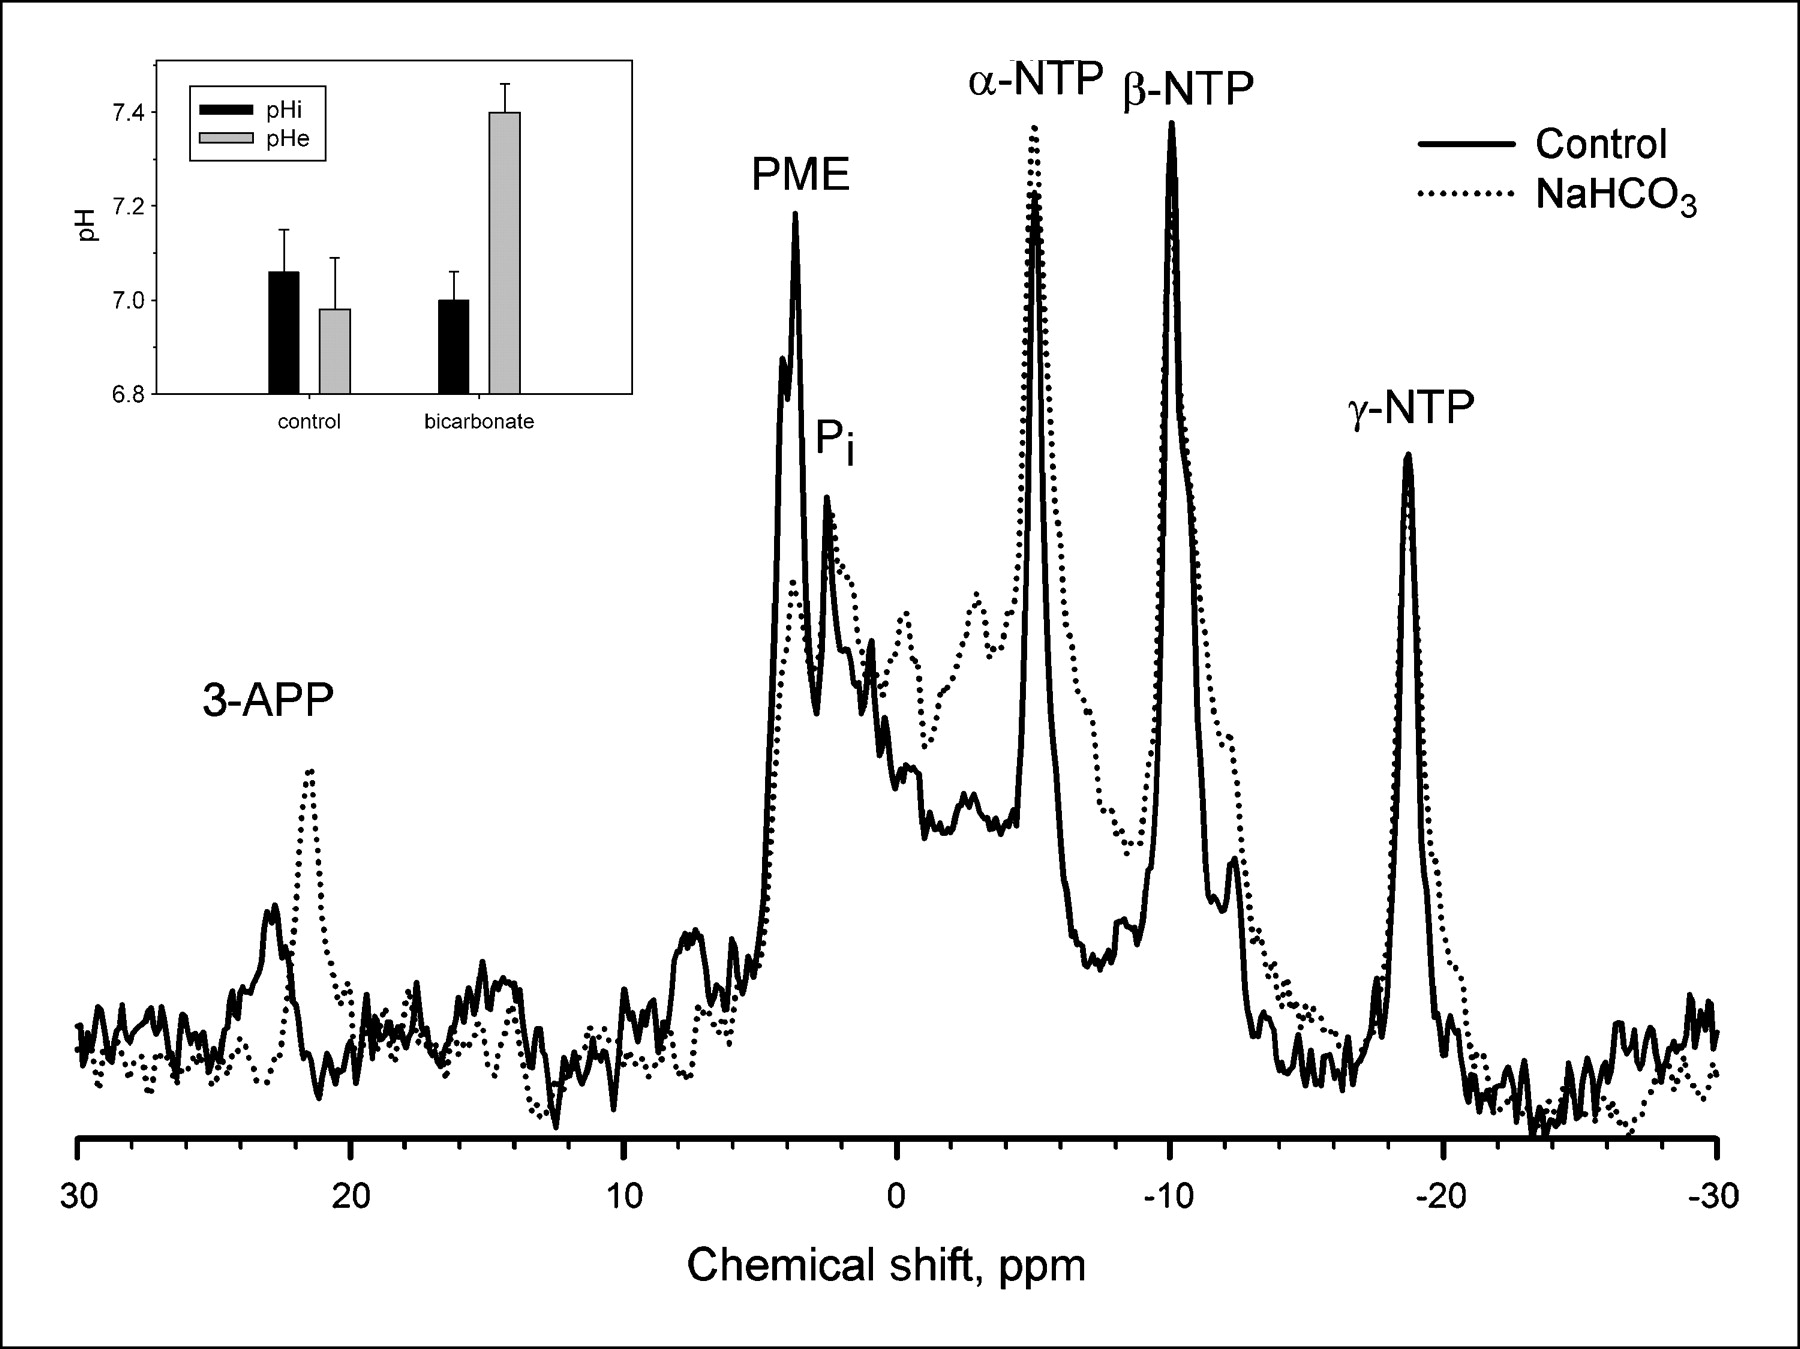
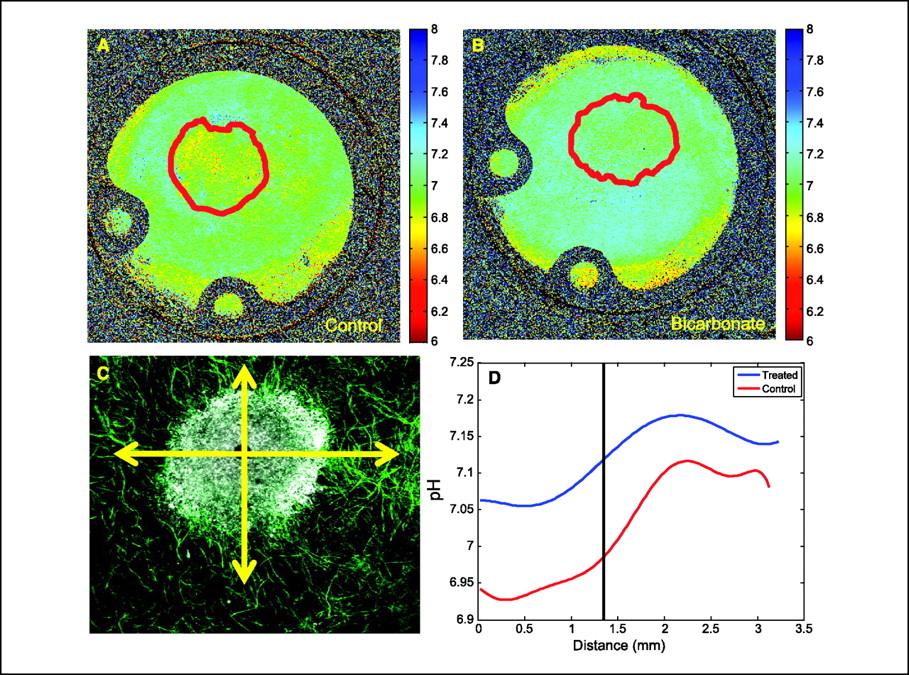
The external pH of solid tumors is acidic as a consequence of increased metabolism of glucose and poor perfusion. Acid pH has been shown to stimulate tumor cell invasion and metastasis in vitro and in cells before tail vein injection in vivo. The present study investigates whether inhibition of this tumor acidity will reduce the incidence of in vivo metastases. Here, we show that oral NaHCO3 selectively increased the pH of tumors and reduced the formation of spontaneous metastases in mouse models of metastatic breast cancer. This treatment regimen was shown to significantly increase the extracellular pH, but not the intracellular pH, of tumors by 31P magnetic resonance spectroscopy and the export of acid from growing tumors by fluorescence microscopy of tumors grown in window chambers.

NaHCO3 therapy also reduced the rate of lymph node involvement, yet did not affect the levels of circulating tumor cells, suggesting that reduced organ metastases were not due to increased intravasation. In contrast, NaHCO3 therapy significantly reduced the formation of hepatic metastases following intrasplenic injection, suggesting that it did inhibit extravasation and colonization. In tail vein injections of alternative cancer models, bicarbonate had mixed results, inhibiting the formation of metastases from PC3M prostate cancer cells, but not those of B16 melanoma. Although the mechanism of this therapy is not known with certainty, low pH was shown to increase the release of active cathepsin B, an important matrix remodeling protease. [Cancer Res 2009;69(6):2260–8]

Introduction

The extracellular pH (pHe) of malignant solid tumors is acidic, in the range of 6.5 to 6.9, whereas the pHe of normal tissues is significantly more alkaline, 7.2 to 7.5 ( 13). Mathematical models of the tumor-host interface ( 4) and in vivo measurements have shown that solid tumors export acid into the surrounding parenchyma ( 5, 6). Previous in vitro studies have shown that tumor cell invasion can be stimulated by acidic conditions and that this may involve lysosomal proteases ( 79). These observations have led to the “acid-mediated invasion hypothesis,” wherein tumor-derived acid facilitates tumor invasion by promoting normal cell death and extracellular matrix degradation of the parenchyma surrounding growing tumors. Furthermore, pretreatment of tumor cells with acid before injection leads to increased experimental metastases ( 10, 11), and these observations suggest that low pH up-regulates proinvasive and survival pathways. It has been argued that metastatic cancers are selected for their ability to export acid ( 12). Acid is a by-product of glucose metabolism, and notably, elevated consumption of fluorodeoxyglucose by more aggressive cancers has been observed with fluorodeoxyglucose positron emission tomography ( 13).

The current work tests the hypothesis that neutralizing the acid pH of tumors will inhibit invasion and, hence, reduce the incidence of spontaneous metastases. Acid pH was inhibited using oral NaHCO3, which has previously been shown to effectively reverse pH gradients in tumors and not affect the pHe of normal tissues ( 14). This was confirmed in the current study using 31P magnetic resonance spectroscopy (MRS) and fluorescence ratio imaging of SNARF-1 in a dorsal skin-fold window chamber. Notably, bicarbonate did not affect the systemic pH or the growth rate of primary tumors but had significant effects on the formation of spontaneous metastases. In two of three experiments, NaHCO3 therapy reduced the colonization of lymph nodes, but in no experiment did it significantly affect the levels of circulating tumor cells. The lymphatic results notwithstanding, these results indicate that inhibition of end-organ metastasis did not occur by a reduction of intravasation. In contrast, the formation of liver metastases following intrasplenic injection of MDA-MB-231 cells was significantly reduced, indicating that end-organ colonization of metastatic sites was affected by NaHCO3 therapy. Similarly, metastases following tail vein injection of PC3M prostate cancer cells were also inhibited by bicarbonate treatment, yet those of B16 melanoma were not. Preliminary investigations into possible mechanisms showed that the release of active cathepsin B into pericellular space was significantly increased by acidic conditions, and thus, NaHCO3 therapy may be acting to inhibit the release of this important matrix remodeling protease.

Materials and Methods

Animals. All animals were maintained under Institutional Animal Care and Use Committee–approved protocols at either the University of Arizona or H. Lee Moffitt Cancer Center. Six- to eight-week-old female severe combined immunodeficient (SCID) mice were used as hosts for MDA-MB-231 tumors, 6-wk-old male SCID beige mice for PC3M tumors, and nu/nu mice for B16 tumors.

β-Galactosidase staining. Harvested lung tissue was sliced into 1-mm sections and placed in PBS containing 2 mmol/L MgCl2 (Mg-PBS) on ice. Sections were fixed in 0.5% glutaraldehyde in Mg-PBS on ice for 30 min and afterward rinsed in PBS to remove residual fixative. Fixed sections were then incubated for 3 h at 37°C in 5-bromo-4-chloro-3-indolyl-β-d-galactopyranoside reaction buffer (35 mmol/L potassium ferrocyanide, 2 mmol/L MgCl2, 0.02% NP40, and 0.01% Na deoxycholate in PBS). After incubation, the tissue sections were washed and stored in PBS. Sections were analyzed using a Stereomaster 4× dissecting microscope (Fisher Scientific) with mounted DC290 ZOOM digital camera (Eastman Kodak Company). Images were captured at the same focal plane with an exposure time of 1/10 s for white-light illumination. β-Galactosidase positive lesions were measured and counted manually by a blinded observer.

Intrasplenic injections. MDA-MB-231 cells (5 × 10⁵) expressing a thermostable firefly luciferase ( 15) were injected into the spleens of SCID mice. Three days postinjection, mice were randomized into bicarbonate and control therapies. Twenty-five days postinjection, spleens and livers were collected and placed in white, clear-bottom, sterile 12-well microtiter plates. Luciferase images were acquired using a VersArray 1300B cooled charge-coupled device camera (Roper Scientific) at 10-min exposures, f2.2. Image data were analyzed with ImageJ. After image acquisition, spleens and livers were homogenized in homogenization buffer (Promega) with five passes in a Dounce homogenizer, followed by addition of 1 volume of cell lysis buffer (Promega). Homogenates were mixed 1:1 with luciferase solution (Promega) and light emission was determined using a Wallac Victor3 (Perkin-Elmer) microtiter plate reader ( 16).

Intravasation. The first step of metastatic spread involves movement of cancer cells from the primary site into the bloodstream (intravasation) either directly or indirectly through the lymphatics ( 17). Measurement of MDA-MB-231/eGFP cells in the blood of tumor-bearing SCID mice was determined by three methods in two separate experiments. In one experiment (113007), untreated (n = 3) and 200 mmol/L bicarbonate–treated (n = 7) animals bearing primary tumors were euthanized after 36 d of tumor growth. At this time point, the primary tumors averaged 463 ± 33.5 mm3 in size in both groups. Blood was extracted by cardiac puncture into microfuge tubes and mixed with an equal volume of 100 mmol/L EDTA to prevent clotting. A blood volume of 10 μL was smeared on glass slides and dried. Green-fluorescing cells were counted manually under a fluorescent microscope at ×40 magnification. Nucleated cells from the remaining blood volume (∼300 μL) were obtained by centrifugation with Histopaque (Sigma), and resulting cells were resuspended in 96-well plates in 100 μL of PBS and measured on a Victor3 with excitation wavelength at 485 nm and emission at 535 nm. In another experiment (011508), blood was extracted by heart puncture from untreated and bicarbonate-treated mice (n = 8 each) by the same methods as above. Average tumor size was 121.8 ± 16.4 mm3. RBC were lysed with fluorescence-activated cell sorting lysing solution (BD Sciences) according to the manufacturer’s instructions. Cells were counter-labeled with LDS-751 nucleic acid dye and analyzed by flow cytometry on a FACScan (BD Biosciences) with a 488-nm argon laser. LDS-751 emits at 670 nm upon excitation at 488 nm and is detectable with the fluorescence 3 detector. Nonspecific fluorescence was differentiated from the green fluorescent protein (GFP) signal by gating on cellular light scattering properties and LDS-751.

Dorsal skin-fold window chamber. Tumor constructs were engineered using the tumor droplet method. MDA-MB-231 cells were suspended in 2.5 mg/mL type I collagen (BD Biosciences) and 1× DMEM at a final concentration of 1 × 10⁶ to 2.5 × 10⁶ cells/mL. Using a 48-well non–tissue-cultured plate, a 15-μL drop of the tumor cell suspension was polymerized in the center of the well. Following brief polymerization (∼1–2 min) at 37°C in the incubator, 200 mL of media [DMEM with 10% fetal bovine serum (FBS)] were added to the wells and the droplets were left until the addition of stromal mix. The stromal mix consisted of 3 mg/mL type I collagen, 1× DMEM, and ∼12,000 to 15,000 microvessel fragments/mL. Typically, when microvessel fragments are directly reconstituted with type I collagen, they undergo spontaneous angiogenesis by day 3 or day 4 in vitro and following implantation anastamose with the host vasculature and form a vascular network (days 4–7 in window chamber). After 2 d in culture, these constructs were removed with forceps and placed directly into the window chamber.

Because the tumors were relatively circular, growth was analyzed along the horizontal and vertical diameters. At the image magnification, each pixel was equal to ∼25 μm. The mean of the horizontal and vertical diameter was used to report the tumor diameter at the time of imaging. Tumor density was estimated based on the gray-level intensity homogeneity in the tumor region of interest. This estimated tumor density was calculated by first computing the gray-level co-occurrence matrix of tumor region. Using the gray-level statistics generated by the gray-level co-occurrence matrix, the gray-level intensity homogeneity was calculated, a metric reflective of the likelihood that neighboring pixels are the same intensity. A higher homogeneity value was suggestive of a denser tumor because the intensities would vary less from pixel to pixel in regions of high cellularity.

Cathepsin-B activity. Cathepsin-B measurements were carried out in a “real-time” assay as described by Linebaugh and colleagues ( 18). Briefly, cells were exposed to a fluorogenic substrate (Z-Arg-Arg-NHMec) in an enclosed system that monitored the rate of fluorescent product (NH2Mec) formation. MDA-MB-231 cells grown on coverslips to 60% to 80% confluence, washed with Dulbecco’s NaCl/Pi, and equilibrated in assay buffer without substrate at 37°C for 5 min. Measurements consisted of (a) a fluorescence baseline for the assay buffer containing 100 μmol/L Z-Arg-Arg-NHMec substrate for 5 min; (b) the rate of fluorescent product formation due to the introduction of cells followed over 10 min; (c) the rate of fluorescent product formation after removal of cells from the cuvette followed over 10 min; and (d) the rate of fluorescent product formation when cells are placed back in cuvette and cell membrane permeabilized by adding 0.1% (v/v) Triton X-100. Cathepsin-B activity was measured following equilibration of cells in media containing 25 mmol/L PIPES at pH 6.8 and 7.4 for 3 d, followed by overnight incubation in 0.2% FBS at the respective pH values. A cathepsin-B inhibitor, CA074, was added at a final concentration of 10 μmol/L to confirm that the activity measured was due to cathepsin B ( 19). Measurements were recorded in a Shimadzu RF-450 spectrofluorometer, with excitation at 380 nm and emission at 460 nm, equipped with a temperature-controlled cuvette holder, microstirrer, and a DR-3 data chart recorder. After data acquisition, the DNA content on each coverslip was determined by measuring fluorescence using SYBR Green I nucleic acid stain (Molecular Probes) in a microtiter plate at 485-nm excitation and 535-nm emission. Concentrations were calculated based on the salmon sperm DNA standard curve. The rate of product formation was expressed as picomoles per minute per microgram of DNA.

Statistics. All statistical calculations were determined using the analysis feature in Prism version 4.03 for Windows (GraphPad Software) or Microsoft Excel. To compare two means, statistical significance was determined by unpaired, one-tailed Student’s t tests assuming equal variance. If variances were significantly different (P < 0.0001), a Welch’s correction for unequal variances was applied. A log-rank test was applied to survival data. A Mann-Whitney-Wilcoxon rank-sum test was used to compare independent groups whose data were ordinal but not interval-scaled.

Results and Discussion

In initial experiments, metastatic MDA-MB-231 adenocarcinoma cells were orthotopically injected into mammary fat pads of female immunodeficient (SCID) mice. Six days after injection, mice were randomized into two groups: one (control) was provided with drinking water and the other (bicarbonate) was provided with 200 mmol/L NaHCO3 ad libitum, which continued for the duration of the experiment. Bicarbonate therapy had no effect on either the animal weights or the rates of growth of the primary tumors. The lack of effects on animal weights (P = 0.98) is shown in Supplementary Fig. S1A, and these data were interpreted to indicate that this therapy did not lead to dehydration because dehydration quickly leads to significant weight loss in experimental mice. Bicarbonate-treated mice drank, on average, 4.2 ± 0.2 mL of water per day, whereas control mice consumed 3.3 ± 0.1 mL/d. The daily intake of bicarbonate was thus calculated to be 36 ± 1.7 mmol/kg/d (9.4 g/m2/d). An equivalent dose in a 70-kg human would be 12.5 g/d ( 20). The lack of an effect on the growth of the primary tumors (P = 0.80) is shown in Supplementary Fig. S1B to D. Although bicarbonate effectively increased the pHe of these large tumors, it did not affect the intracellular pH (pHi), as measured by MRS (see below), and this may be reflected in a lack of an effect on growth rates ( 21, 22).

Despite a lack of an effect on primary tumor growth, bicarbonate therapy led to significant reductions in the number and size of metastases to lung, intestine, and diaphragm. Figure 1A and B shows the size and number of β-galactosidase expressing spontaneous lung metastases after 30 and 60 days of primary tumor growth, respectively. In the 30-day experiment, pooled data (n = 12 mice per group) showed that the bicarbonate-treated mice had a total of 147 metastatic lung lesions, whereas the control group had 326 lung lesions (P = 0.03). The average lesion diameters (± SE) were 4.5 ± 0.12 and 5.2 ± 0.14 mm in the NaHCO3 and control groups, respectively (P < 0.0001). In the 60-day experiment (n = 20 and 15 for control and NaHCO3 groups, respectively), the numbers of pixels associated with lesions >60 μm in diameter were scored. The average numbers of lesion pixels per animal in control and NaHCO3 groups were 382 and 74, respectively (P = 0.0004). None of the animals treated with NaHCO3 had more than 240 lesion pixels per animal, whereas 10 of 20 of the control animals had more than 240 lesion pixels. Both experiments showed dramatically fewer lesions in the bicarbonate-treated group than in control animals.

Figure 1.

Effect of NaHCO3 on metastases and survival. MDA-MB-231 were obtained from American Type Culture Collection and maintained in growth media (DMEM/F-12 supplemented with 10% FBS) at 37°C with 5% CO2 in a humidified atmosphere. These cells were stably transfected with expression vectors for hygromycin-resistant pcDNA3.1/LacZ (Invitrogen). These β-gal–labeled MDA-MB-231 cells (107), suspended in 0.2 mL of 0.8% sterile saline, were injected s.c. into the left inguinal mammary fat pads of 6-wk-old female SCID mice. Mice (n = 8) were started on drinking water (ad libitum) supplemented with 200 mmol/L NaHCO3 at 6 d postinjection and maintained along with untreated animals (n = 8). After 30 d of primary tumor growth, the animals were sacrificed and the β-gal–positive lung lesions were counted and sized after staining, as shown in A. Mean lesion diameters (P < 0.0001) and frequencies (P = 0.0342) were significantly different between the two groups as determined by two-tailed unpaired t test with Welch’s correction for unequal variances. In a repeat of this experiment, 106 β-gal-MDA-MB-231 cells were injected into inguinal mammary fat pads, and control (n = 9) and NaHCO3-treated (n = 15) animals were maintained for 60 d before sacrifice. In this experiment, lung images were analyzed using ImagePro Plus to determine the metastatic tumor burden by counting the number of β-gal–positive pixels per animal. B, numbers of lung lesions per animal following 60 d of growth in the presence of NaHCO3 in drinking water. The frequency of lesions per animal in the NaHCO3-treated mice was compared with that in untreated controls by unpaired t test (P = 0.0004). In a third experiment, MDA-MB-231 cells were stably transfected to express neomycin-resistant pcDNA3/EGFP (a gift from Peter Ratcliffe, Oxford University, Oxford, United Kingdom). MDA-MB-231/eGFP cells (6.5 × 10⁶) were injected into inguinal mammary fat pads of animals that were randomized into bicarbonate and control groups (n = 12 per group) 6 d postinoculation. Tumors were allowed to grow for 5 to 6 wk (to a volume of 600 mm3), at which time they were surgically removed. If the primary regrew (as was the case in 9 of 24 animals), it was resected again. Animals were monitored biweekly and maintained on bicarbonate or water until they evidenced a lymph node lesion >300 mm3 in size, at which time they were sacrificed and necropsied by examination with a fluorescence dissecting scope. Data from this experiment are plotted as a Kaplan-Meier survival curve (C). The difference in the survival curve for the bicarbonate versus control animals was tested using the log-rank test (P = 0.027).

This reduction in metastases also led to increased survival. Figure 1C shows the Kaplan-Meier survival curve, which shows that bicarbonate therapy increased survival (log-rank; P = 0.027). As shown in Fig. 2 , on necropsy, the control group contained significant and notable fluorescent lung lesions, whereas the bicarbonate group had little, if any, fluorescence (Wilcoxon rank-sum test, P = 0.0015). These data were quantified for other metastatic sites in all animals and showed reductions in frequency and fluorescence density in visceral organ (intestines, pancreas, liver, spleen, bladder, and liver) and mesenteric metastases in the bicarbonate-treated groups ( Fig. 3A ). These data are notable in that the effect of the bicarbonate therapy was greater than in any of the previous experiments, yet the median ages of sacrifice were >100 days for both control and bicarbonate groups (i.e., significantly longer than either of the previous experiments).

Figure 2.

Lung metastases. Images were obtained at time of sacrifice from individual (numbered) mice in control and bicarbonate groups of the experiment shown in Fig. 1C. At time of necropsy, organ and lymph node green fluorescent tumor metastases from necropsies were detected by the Illumatool Bright Light System (LT-9500) using a 470 nm/40 nm excitation filter (Lightools Research) and imaged using a Stereomaster 4× dissecting microscope (Fisher Scientific) with mounted DC290 Zoom digital camera (Eastman Kodak). Images were captured at the same focal plane in the presence of 480-nm excitation and >490-nm filtered emission with an exposure time of 4 s for GFP images and 1/10 s for white-light illumination. Image data were analyzed with ImageJ (http://rsb.info.nih.gov/ij/) by segmenting the green channel and counting total positive pixels per field.

Figure 3.

Metastases and cathepsin B activity. A, at time of sacrifice, animals in the survival experiment shown in Fig. 1C were necropsied and metastases were quantified by fluorescence. Images were captured as described in Fig. 1C and fluorescence was quantified following RGB segmentation using ImageJ analysis software. Columns, average fluorescence pixel densities (fluorescence intensities × area) for lymph nodes, visceral organs, mesentery, and lungs; bars, SE. AUF, arbitrary units of fluorescence. B, red fluorescent protein–expressing MDA-MB-231 tumor cells were incubated at low and high pH values for 4 d, and then overnight in 0.2% serum media, followed by assessment of pericellular and intracellular cathepsin B activity in live cells via a “real time assay”, as described in Materials and Methods.

Although it has previously been shown that chronic oral NaHCO3 can lead to reversal of tumor acidosis ( 14), this was confirmed here for the MDA-MB-231 tumor model using 31P MRS of tumor-bearing animals after 3 weeks of therapy (4 weeks postinoculation). pHi was measured with the resonant frequency of inorganic phosphate, and pHe was measured with the exogenous pH indicator 3-aminopropylphosphonate ( 23, 24). 31P spectra of NaHCO3-treated tumors exhibited significant shifts in the resonant frequency of 3-aminopropylphosphonate, with little or no change in the frequency of inorganic phosphate ( Fig. 4 ). Average pHe values were 7.4 ± 0.06 in the NaHCO3-treated tumors, compared with pH 7.0 ± 0.11 under control conditions ( Fig. 4, inset). Notably, the pHi of tumors was unaffected, being 7.0 ± 0.06 and 7.1 ± 0.09 under treated and control conditions, respectively ( Fig. 4, inset). The pHi and pHe were also measured in nontumor tissues in the same animals (e.g., hind limb muscle) with the observation that the pHi and pHe were unaffected by bicarbonate, being 7.22 ± 0.04 and 7.40 ± 0.08, respectively, in both groups (data not shown), which was consistent with previous results ( 14).

Figure 4.

The effect of NaHCO3 treatment on tumor pH. All in vivo measurements were done at 4.7 T on a Bruker Biospec magnetic resonance imaging spectrometer equipped with a 14 G/cm self-shielded gradient insert, using volume excitation and home-built solenoid coils for reception. Image-guided volume-selective 31P magnetic resonance spectra of tumors in anesthetized mice were acquired as described in ref. 14. The pHe and pHi were measured from the chemical shifts of exogenous 3-aminopropylphosphonate and endogenous inorganic phosphate, respectively ( 17). For spectroscopy of tumors, 0.4 mL of 0.24 mol/L 3-aminopropylphosphonate was administered i.p. to mice a few minutes before anesthetization. Following anesthetization, a further 0.4 mL of 3-aminopropylphosphonate was injected i.p., and the mouse prepared for 31P MRS as before. This figure illustrates representative 31P magnetic resonance spectra from control (solid) and NaHCO3-treated (dotted) MDA-MB-231 tumor xenografts. 3-APP, 3-aminopropylphosphonate; Pi, endogenous inorganic phosphate; PME, phosphomonoesters; NTP, nucleoside triphosphate. Inset, columns, average values for tumor pHi (P = 0.89) and pHe (P = 0.01) in the absence and presence of bicarbonate treatment (n = 6 mice each); bars, SE. Details of the acquisition and processing parameters are provided in Materials and Methods.

Despite significant effects on the formation of metastases and tumor pHe, chronic bicarbonate therapy had no effect on blood chemistries, indicating that systemic pH was fully compensated in these animals (Supplementary Table S1). Thus, as expected due to the chronic nature of the treatment, NaHCO3 did not lead to systemic metabolic alkalosis. Rather, we hypothesize that inhibition of tumor metastasis was due to increased bicarbonate “buffering” of interstitial fluid of either the primary or the metastatic tumors. Thus, the bicarbonate levels in tumors were increased to be consistent with the rest of the body, leading to a selective increase in tumor pHe. This effect has been modeled using reaction diffusion kinetic modeling ( 25) and showed that (a) in the face of a high acid load from hypermetabolic tumor cells, the bicarbonate effect will be incomplete even at 200 mmol/L; and (b) alternative buffers with higher pKa values should be more efficacious. Consistent with these predictions, a dose-response experiment with a 30-day end point showed that concentrations as low as 50 mmol/L reduced the incidence of spontaneous metastases, yet the largest effect was observed at the highest dose investigated, 200 mmol/L (Supplementary Table S2), indicating that, even at this dose, the effect is incomplete. The lack of a complete effect was further investigated by inoculating mice (n = 3 per group) bearing dorsal skin-fold window chambers with GFP-transfected MDA-MB-231 tumor cells. As above, ad libitum 200 mmol/L NaHCO3 was begun 6 days postinoculation. After 1 and 2 weeks of therapy, the pHe was measured by fluorescence ratio imaging of SNARF-1, as described in Materials and Methods ( 5). Representative GFP images used for segmentation are shown in Supplementary Fig. S2. These were used to define a region of interest delineating the tumor boundary, indicated by the solid red line. The corresponding SNARF-1 ratio-derived pHe images for control and bicarbonate-treated animals are shown in Fig. 5A and B , respectively. Note that pHe is more acidic in the control tumors and that this acidity extends beyond the tumor boundary, whereas the acid pHe regions of the bicarbonate-treated mice were confined within the tumor volume. Data were analyzed along coaxial radial lines drawn from the centroid of the tumor ( Fig. 5C) and the least squares fit for all experiments is shown in Fig. 5D, with the centroid located at “0” and the edge of the tumor indicated by the vertical line. Table 1C shows that, whereas the intratumoral pHe was not significantly affected in the bicarbonate group (P = 0.19), the peritumoral pHe, measured within 0.2 mm of the tumor edge, was significantly higher in the bicarbonate-treated group compared with controls (P = 0.05). Thus, both fluorescence and MRS showed higher tumor pHe values in the bicarbonate-treated groups, although the MRS showed a greater effect. These apparent differences may be due to the different preparations, such as measurement by two different techniques (MRS versus fluorescence) in two different systems (orthotopic versus heterotopic) following two different treatment times (21 versus 7 days). Follow-up imaging of window chambers 7 days later showed that the changes in tumor diameters were not significantly different between groups, but that there were significant (P = 0.002) differences in the tumor densities. Specifically, the densities increased with time in the control tumors and decreased in the bicarbonate-treated tumors. Whereas the importance of these observations is not clear, it may lead to a practical application. Tumor cell densities can be measured noninvasively using diffusion-weighted magnetic resonance imaging ( 26), and hence, this imaging modality may be useful as a quantitative biomarker for the effects of bicarbonate therapy in vivo.

Figure 5.

Microscopic pH gradients in window chambers. Tumors were inoculated into window chamber as described in Materials and Methods. pHe was measured following injection of SNARF-1 free acid by excitation with a He/Ne laser at 543 nm and emissions were collected in channel 1 with a 595/50-nm bandpass and in channel 2 with a 640-nm-long pass filter. Confocal images were converted to .tif format using ImageJ (http://rsb.info.nih.gov/ij/); respective background images were subtracted from each fluorescence image (red channel, blue channel); and image was then smoothed with a 2 × 2 kernel. The two images were then divided, subsequently removing zeros and not-a-numbers (NANs), creating a ratiometric image. The in vitro pH calibration was then applied to every pixel in the ratiometric image. Regions of interest were drawn around the tumor, the proximal peritumor region, and the distal “normal” region, and the mean pHe was calculated in these regions. The spatial pH distribution was calculated by drawing an intensity profile (5 pixels wide) from the center of the tumor out to the edge of the window chamber. These profiles were drawn in four orthogonal radial directions, originating from the tumor centroid. The pH profiles were then aligned so that they coincided at the tumor margin using the GFP image to determine the tumor rim. Representative pHe images are shown for untreated (A) and bicarbonate-treated (B) mice (10 × field of view, 12.5 mm). Red lines, region of interest of tumor, defined by GFP images, shown in Supplementary Fig. S2. C, merged confocal image of tumor (white) surrounded by a labeled microvascular network (green). Radial lines, directions along which pHe values were measured. D, least-square fit across all directions and all tumors showing pHe distributions along radial lines for control and bicarbonate-treated tumors. “0” is centroid of tumor, and vertical line indicates tumor edge.

Table 1.

Quantitative analysis of intravasation, extravasation, and pH
  Control Bicarbonate P *
(A) Intravasation
  n Mean (range) n Mean (range)  
Manual (no. of cells) 3 0 (0) 7 1.3 (0–7) NS
Fluorescence (AUF) 3 124 (70–180) 7 746 (0–4,358) NS
Flow (cells/100 μL) 8 3.6 (0–13) 8 1.5 (0–10) NS
(B) Extravasation
n Mean (SE) n Mean (SE) P
Liver 3 109.0 (46.0) 3 11.9 (10.3) 0.007
Spleen 3 231.6 (3.6) 3 608.0 (56.0) 0.011
Ratio 3 0.54 (0.25) 3 0.035 (0.020) <0.001
(C) pH and growth data from window chambers
n Mean (SE) n Mean (SE) P
Intratumor pHe 4 7.00 (0.04) 3 7.07 (0.03) 0.19
Peritumor pHe 4 7.06 (0.00) 3 7.16 (0.03) 0.05
Distant pHe 4 7.11 (0.03) 3 7.15 (0.03) 0.14
ΔDiameter 4 −2.07 (13.32) 3 −5.88 (2.51) 0.39
ΔDensity 4 0.71 (0.26) 3 −3.29 (1.07) 0.002
  • NOTE: See Materials and Methods for experimental and analytic details. Abbreviations: AUF, arbitrary units of fluorescence; NS, not significant. * P value from nonpaired Student’s t

To begin investigating the mechanism of the bicarbonate effect, experiments were designed to separate early events (intravasation) from later events (extravasation and colonization) of the spontaneous metastasis paradigm. Spontaneous metastases occur via movement of tumor cells from the primary tumor into the bloodstream (intravasation), either directly or indirectly through the lymphatics. In xenografts, this can involve active local invasion or a passive process of shedding ( 27). Following intravasation, the circulating tumor cells lodge and colonize in distant sites. There is some controversy whether this occurs via simple lodging of circulating tumor cells in small vessels (prompting local ischemia) or whether it involves specific interaction of circulating tumor cells with post-capillary endothelia followed by extravasation ( 17, 28). To investigate the effect of bicarbonate therapy on intravasation, the incidences of lymphatic involvement and circulating tumor cells were quantified. Lymph node status was assessed in SCID mice inoculated with GFP-expressing MDA-MB-231 tumor cells, which were randomized into control (n = 12) and bicarbonate-treated (n = 11) groups. Primary tumors were grown for 40 days (to volumes of 800–1000 mm3), at which time the animals were sacrificed and lymph nodes and other organs examined by fluorescence imaging. For the purpose of scoring, lymph nodes were characterized as “trace,” with a few fluorescent colonies, or “positive,” wherein the entire lymph node was inflamed. Examples of these are shown in Supplementary Fig. S3. Mice were scored from 0 to 6, as described in Supplementary Table S3, and these analyses showed that most had lymphatic involvement, with those of the NaHCO3-treated animals being less developed. The majority of the NaHCO3-treated animals (9 of 12) had only traces of fluorescence in their lymph nodes, whereas 7 of 11 of the control group had strongly positive nodes and/or metastases (P = 0.044, Mann-Whitney-Wilcoxon). Similarly, the lymph node involvement in the survival study showed a more significant effect on the development of lymph node metastases to >300 mm3 (log-rank P = 0.02). As a further test of intravasation, circulating tumor cells were measured in blood from mice bearing GFP-expressing tumors by manual counting of whole blood smears, flow cytometry following erythrocyte hemolysis, and raw fluorescence of blood extracts. With all end points, there were low numbers of circulating tumor cells and no evidence to suggest differences between bicarbonate-treated and control groups ( Table 1A). From these data, we conclude that, whereas bicarbonate may have an effect on lymph node colonization, this does not conclusively lead to an increase in the numbers of circulating tumor cells, although this conclusion is tempered by the low numbers of circulating tumor cells in both conditions.

The effect of bicarbonate therapy on extravasation was measured in two ways. Because breast cancer commonly metastasizes to the liver, the incidence of liver metastases 21 days after intrasplenic injection of 104 luciferase-expressing MDA-MB-231 cells was used as a measure of extravasation for this system ( 29). Table 1B shows that the luciferase levels in livers of bicarbonate-treated mice were significantly lower than those in controls, whether expressed as raw counts or normalized to splenic luciferase values. Thus, in this system, bicarbonate therapy had a more pronounced effect on the process of extravasation and colonization compared with intravasation. The generality of this phenomenon was examined in other cancer models by monitoring metastases following tail vein injection of luciferase-expressing PC3M human prostate cancer cells or B16 mouse melanoma cells. Supplementary Fig. S4 shows luciferase images from both systems that show a clear difference in the PC3M system and a clear lack of an effect in the B16 system. The progression of metastases in PC3M is shown in Supplementary Fig. S5, with the difference between bicarbonate and controls groups being significant (P = 0.04) at 35 days. Although the differences in the B16 system were not significantly different, the pooled values for the bicarbonate group were consistently lower than those of controls at all time points (data not shown). It should also be noted that the B16 tumors are much faster growing, leading to termination of all animals at 17 days, compared with >42 days for the PC3M tumors. Thus, either these cells colonize in a pH-independent fashion or their rates of acid production simply overpower the ability of bicarbonate to effectively buffer the pH ( 25). Nonetheless, these data show that, for at least two human cancers (MDA-MB-231 and PC3M), bicarbonate reduces the efficiency of tumor colonization at distant sites.

The effects of bicarbonate observed in this study could be exerted at either the primary or the metastatic site, and these are currently under investigation. On one hand, it may be that the acid pH of the primary tumor induces a stress response in these cells, leading to increased survival. This would be consistent with previous observations of Hill and Rofstad, who showed that pretreatment of melanoma cells with acid pH before injection leads to enhanced survival at metastatic sites ( 10, 11). Alternatively, it is possible that the bicarbonate buffering inhibits local invasion at the metastatic site. This has been formulated as the acid-mediated invasion hypothesis, wherein tumor-derived acid is excreted into the surrounding parenchyma, leading to degradation of the surrounding extracellular matrix ( 5).

Whether at the primary or the metastatic site, acid pH seems to stimulate invasive behavior and increased survival, either by selection or induction ( 79). Acid pH has been shown to induce the expression and activity of a number of systems involved in matrix remodeling. These include matrix metalloproteinases such as collagenase (MMP1) or gelatinases (MMP-2 or MMP-9; refs. 8, 10, 30); lysosomal proteases such as cathepsin B, D, or L ( 9, 31, 32), which may result from acid-induced lysosomal turnover ( 7, 33); and hyaluronidase and the hyaluronan receptor CD44 ( 3436). Additionally, low pH can stimulate neoangiogenesis through induction of vascular endothelial growth factor or interleukin-8 ( 10, 3739), or it may stimulate invasion simply by inducing apoptosis in parenchymal cells ( 40, 41), as we have previously shown ( 5), at the same time selecting for tumor cells that are apoptosis resistant. Notably, CD44 is associated with breast cancer cells with stem cell–like properties, and these are noted for being resistant to environmentally induced apoptosis ( 42, 43). To begin investigating the myriad of possible molecular mechanisms, we assayed cathepsin B ( 18) in acid-treated MDA-MB-231 cells, and we observed that the activity of this protease secreted into the media was increased up to 4-fold, with no effect on the cell-associated activities ( Fig. 3B). Thus, it seems that the acid pHe of tumors can induce the release of this protease that is involved in extracellular matrix turnover in breast cancer ( 44). Experiments are under way to determine if bicarbonate therapy will inhibit this activity in vivo.

Conclusions

The above data have shown that oral bicarbonate therapy significantly reduced the incidence of metastases in experimental models of breast and prostate cancer and that the effect seems to be primarily on distal (i.e., colonization), rather than proximal (i.e., intravasation), processes. It is not known whether bicarbonate is exerting its effects by decreasing survival of circulating tumor cells (although the numbers are not affected) or by inhibiting colonization at the metastatic site. Increases in pHe significantly reduced the release of a lysosomal protease, cathepsin B.

Medically, the idea of treating cancer through p.o. administration of buffers is attractive but tethered to caveats. Reaction diffusion models show that the effect of bicarbonate on the pHe gradient will be graded with dose and that, at the current dose of 200 mmol/L, is not saturating. This dose translates to an intake of ∼1.5 μmol/h/g of whole mouse. By comparison, the acid production rate of tumors can be ∼100 μmol/h/g of tumor weight ( 45). Thus, these doses of NaHCO3 may be able to counteract the acid load of a 15-mg tumor, which translates to ∼105 cells or a 1-mm3 micrometastasis. The effectiveness of this therapy will be reduced with larger tumors ( 25). It is somewhat surprising that this incomplete effect had such a dramatic effect on metastases. Another concern is that bicarbonate, with an effective pKa of 6.24, would seem to be poorly suited as an alkalinizing buffer; thus, it is possible that better pHe control and more dramatic antimetastatic effects will be observed with a higher pKa buffer. However, it remains possible that this effect may be specific for buffers in the bicarbonate/CO2 family through involvement of carbonic anhydrase activity, which is important to pH regulation in tumors ( 46). Notwithstanding these concerns, however, the dramatic effect of bicarbonate therapy on the formation of breast cancer metastases in this model system warrants further investigation.

Acknowledgments

Grant support: NIH grant CA 077575 (R.J. Gillies).

We thank Libia Luevano, Bethany Skovan, Wendy Tate, James Averill, Maria Lluria-Prevatt, Kathy Brown, and Merry Warner (at University of Arizona) and Robert Engelman, Noreen Leutteke, and Dominique Pasqualini (at Moffitt Cancer Center) for their contributions to this work.

References
  1. Griffiths JR. Are cancer cells acidic? Br J Cancer 1991; 64: 425–7. Medline
  2. Vaupel P, Kallinowski F, Okunieff P. Blood flow, oxygen and nutrient supply, and metabolic microenvironment of human tumors: a review. Cancer Res 1989; 49: 6449–65. Abstract/FREE Full Text
  3. Wike-Hooley JL, Haveman J, Reinhold HS. The relevance of tumour pH to the treatment of malignant disease. Radiother Oncol 1984; 2: 343–66. Medline
  4. Gatenby RA, Gawlinski ET. Mathematical models of tumour invasion mediated by transformation-induced alteration of microenvironmental pH. Novartis Found Symp 2001; 240: 85–96. Medline
  5. Gatenby RA, Gawlinski ET, Gmitro AF, Kaylor B, Gillies RJ. Acid-mediated tumor invasion: a multidisciplinary study. Cancer Res 2006; 66: 5216–23. Abstract/FREE Full Text
  6. Gillies RJ, Raghunand N, Karczmar GS, Bhujwalla ZM. MRI of the tumor microenvironment. J Magn Reson Imaging 2002; 16: 430–50. CrossRefMedline
  7. Glunde K, Guggino SE, Solaiyappan M, Pathak AP, Ichikawa Y, Bhujwalla ZM. Extracellular acidification alters lysosomal trafficking in human breast cancer cells. Neoplasia 2003; 5: 533–45. Medline
  8. Martinez-Zaguilan R, Seftor EA, Seftor RE, Chu YW, Gillies RJ, Hendrix MJ. Acidic pH enhances the invasive behavior of human melanoma cells. Clin Exp Metastasis 1996; 14: 176–86. CrossRefMedline
  9. Rozhin J, Sameni M, Ziegler G, Sloane BF. Pericellular pH affects distribution and secretion of cathepsin B in malignant cells. Cancer Res 1994; 54: 6517–25. Abstract/FREE Full Text
  10. Rofstad EK, Mathiesen B, Kindem K, Galappathi K. Acidic extracellular pH promotes experimental metastasis of human melanoma cells in athymic nude mice. Cancer Res 2006; 66: 6699–707. Abstract/FREE Full Text
  11. Schlappack OK, Zimmermann A, Hill RP. Glucose starvation and acidosis: effect on experimental metastatic potential, DNA content and MTX resistance of murine tumour cells. Br J Cancer 1991; 64: 663–70. Medline
  12. Gatenby RA, Gillies RJ. A microenvironmental model of carcinogenesis. Nat Rev Cancer 2008; 8: 56–61. CrossRefMedline
  13. Gillies R, Robey IF, Gatenby RA. Causes and consequences of increased glucose consumption in cancers. J Nucl Med 2008; 49: 24–42S. CrossRef
  14. Raghunand N, He X, van Sluis R, et al. Enhancement of chemotherapy by manipulation of tumour pH. Br J Cancer 1999; 80: 1005–11. CrossRefMedline
  15. Baggett B, Roy R, Momen S, Morgan S, Tisi L, Morse D, Gillies RJ. Thermostability of firefly luciferases affects efficiency of detection by in vivo bioluminescence. Mol Imaging 2004; 3: 324–32. CrossRefMedline
  16. Sadikot RT, Jansen ED, Blackwell TR, et al. High-dose dexamethasone accentuates nuclear factor-κB activation in endotoxin-treated mice. Am J Respir Crit Care Med 2001; 164: 873–8. Abstract/FREE Full Text
  17. Ruoslahti E. How cancer spreads. Sci Am 1996; 275: 72–7. Medline
  18. Linebaugh BE, Sameni M, Day NA, Sloane BF, Keppler D. Exocytosis of active cathepsin B enzyme activity at pH 7.0, inhibition and molecular mass. Eur J Biochem 1999; 264: 100–9. Medline
  19. Murata M, Miyashita S, Yokoo C, et al. Novel epoxysuccinyl peptides. Selective inhibitors of cathepsin B, in vitro. FEBS Lett 1991; 280: 307–10. CrossRefMedline
  20. Freireich EJ, Gehan EA, Rall DP, Schmidt LH, Skipper HE. Quantitative comparison of toxicity of anticancer agents in mouse, rat, hamster, dog, monkey, and man. Cancer Chemother Rep 1966; 50: 219–44. Medline
  21. Gillies RJ. Intracellular pH and control of proliferation in animal cells. In: Cameron IB, Poole TB, editors. The transformed cell. New York and London: Academic Press; 1981. p. 347–95.
  22. Pouyssegur J, Franchi A, Pages G. pHi, aerobic glycolysis and vascular endothelial growth factor in tumour growth. Novartis Found Symp 2001; 240: 186–96. Medline
  23. Gillies RJ, Liu Z, Bhujwalla Z. 31P-MRS measurements of extracellular pH of tumors using 3-aminopropylphosphonate. Am J Physiol 1994; 267: C195–203. Medline
  24. Gillies RJ, Raghunand N, Garcia-Martin ML, Gatenby RA. pH imaging. A review of pH measurement methods and applications in cancers. IEEE Eng Med Biol Mag 2004; 23: 57–64. Medline
  25. Silva AS, Yunes JA, Gillies RJ, Gatenby RA. The potential role of systemic buffers in reducing intratumoral extracellular pH and acid-mediated invasion. Cancer Res 2009; 69: 2677–84. Abstract/FREE Full Text
  26. Galons J-P, Jennings D, Morse D, Gillies RJ. Mechanisms underlying the increase of the apparent diffusion coefficient of water in response to anti-cancer therapy. Israeli J Biochem 2003; 43: 91–101.
  27. Bockhorn M, Jain RK, Munn LL. Active versus passive mechanisms in metastasis: do cancer cells crawl into vessels, or are they pushed? Lancet Oncol 2007; 8: 444–8. CrossRefMedline
  28. Fidler IJ. Cancer metastasis. Br Med Bull 1991; 47: 157–77. Abstract/FREE Full Text
  29. Ishizu K, Sunose N, Yamazaki K, et al. Development and characterization of a model of liver metastasis using human colon cancer HCT-116 cells. Biol Pharm Bull 2007; 30: 1779–83. CrossRefMedline
  30. Turner GA. Increased release of tumour cells by collagenase at acid pH: a possible mechanism for metastasis. Experientia 1979; 35: 1657–8. CrossRefMedline
  31. Cuvier C, Jang A, Hill RP. Exposure to hypoxia, glucose starvation and acidosis: effect on invasive capacity of murine tumor cells and correlation with cathepsin (L + B) secretion. Clin Exp Metastasis 1997; 15: 19–25. CrossRefMedline
  32. Rochefort H. Biological and clinical significance of cathepsin D in breast cancer. Semin Cancer Biol 1990; 1: 153–60. Medline
  33. Raghunand N, Martinez-Zaguilan R, Wright SH, Gillies RJ. pH and drug resistance. II. Turnover of acidic vesicles and resistance to weakly basic chemotherapeutic drugs. Biochem Pharmacol 1999; 57: 1047–58. CrossRefMedline
  34. Bourguignon LY, Singleton PA, Diedrich F, Stern R, Gilad E. CD44 interaction with Na+-H+ exchanger (NHE1) creates acidic microenvironments leading to hyaluronidase-2 and cathepsin B activation and breast tumor cell invasion. J Biol Chem 2004; 279: 26991–7007. Abstract/FREE Full Text
  35. Madan AK, Yu K, Dhurandhar N, Cullinane C, Pang Y, Beech DJ. Association of hyaluronidase and breast adenocarcinoma invasiveness. Oncol Rep 1999; 6: 607–9. Medline
  36. Stern R, Shuster S, Neudecker BA, Formby B. Lactate stimulates fibroblast expression of hyaluronan and CD44: the Warburg effect revisited. Exp Cell Res 2002; 276: 24–31. CrossRefMedline
  37. Fukumura D, Xu L, Chen Y, Gohongi T, Seed B, Jain RK. Hypoxia and acidosis independently up-regulate vascular endothelial growth factor transcription in brain tumors in vivo. Cancer Res 2001; 61: 6020–4. Abstract/FREE Full Text
  38. Shi Q, Le X, Wang B, et al. Regulation of vascular endothelial growth factor expression by acidosis in human cancer cells. Oncogene 2001; 20: 3751–6. CrossRefMedline
  39. Xu L, Fidler IJ. Acidic pH-induced elevation in interleukin 8 expression by human ovarian carcinoma cells. Cancer Res 2000; 60: 4610–6. Abstract/FREE Full Text
  40. Park HJ, Lyons JC, Ohtsubo T, Song CW. Acidic environment causes apoptosis by increasing caspase activity. Br J Cancer 1999; 80: 1892–7. CrossRefMedline
  41. Williams AC, Collard TJ, Paraskeva C. An acidic environment leads to p53 dependent induction of apoptosis in human adenoma and carcinoma cell lines: implications for clonal selection during colorectal carcinogenesis. Oncogene 1999; 18: 3199–204. CrossRefMedline
  42. Sheridan C, Kishimoto H, Fuchs RK, et al. CD44+/CD24 breast cancer cells exhibit enhanced invasive properties: an early step necessary for metastasis. Breast Cancer Res 2006; 8: R59. CrossRefMedline
  43. Shipitsin M, Campbell LL, Argani P, et al. Molecular definition of breast tumor heterogeneity. Cancer Cell 2007; 11: 259–73. CrossRefMedline
  44. Mohamed MM, Sloane BF. Cysteine cathepsins: multifunctional enzymes in cancer. Nat Rev Cancer 2006; 6: 764–75. CrossRefMedline
  45. Zu XL, Guppy M. Cancer metabolism: facts, fantasy, and fiction. Biochem Biophys Res Commun 2004; 313: 459–65. CrossRefMedline
  46. Swietach P, Vaughan-Jones RD, Harris AL. Regulation of tumor pH and the role of carbonic anhydrase 9. Cancer Metastasis Rev 2007; 26: 299–310. CrossRefMedline

Click here to see the original study on the NIH PubMed website!

Note: Supplementary data for this article are available at Cancer Research Online (http://cancerres.aacrjournals.org/).

© 2009 American Association for Cancer Research

Organic Food has Twice the Nutritional Value of Commercial Food

This is a classic study done in 1993 showing the nutritional value at the time between organic food and less nutritious, commercially-grown food. But this was well before genetically modified foods (GMOs) came on the scene. GMOs make the situation much worse now since they’re designed almost entirely to resist diseases and pesticides — allowing many times more toxic chemicals to be used while creating numerous health risks for humans.

Once upon a time, studies of organic and commercial foods (now called “non-GMO” foods) were only concerned with whether organic farming improved nutrition and yields. But today, GMO foods are not at all concerned with nutrition! You see, GMOs were only really designed to resist pests and diseases. Nutrition and your health are the last things they think about when designing GMOs — and the latest research shows that GMOs actually reduce yields!

ABSTRACT

a_fruitbasket2_tr_1
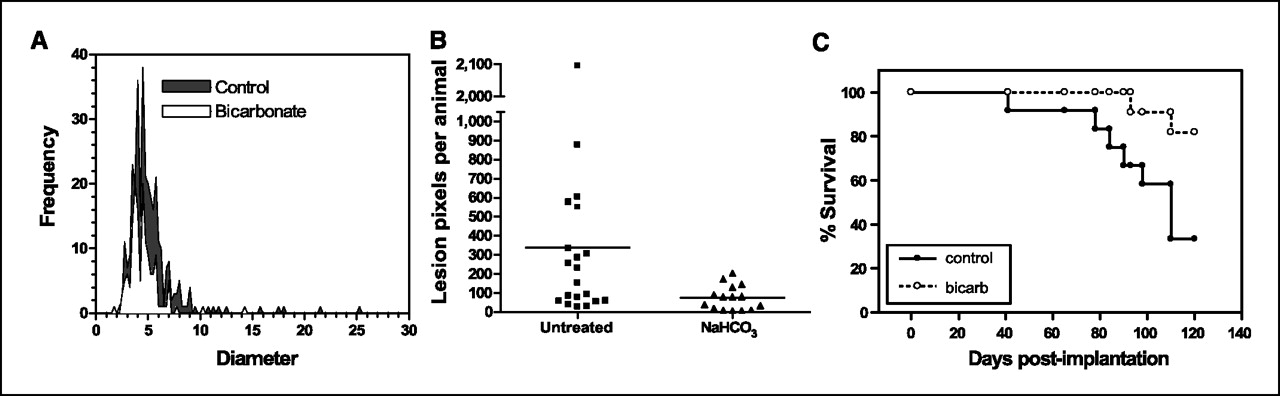
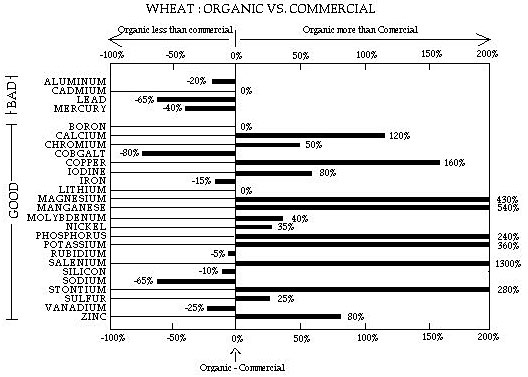
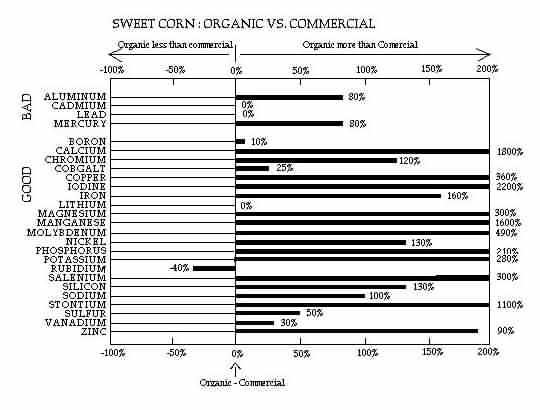
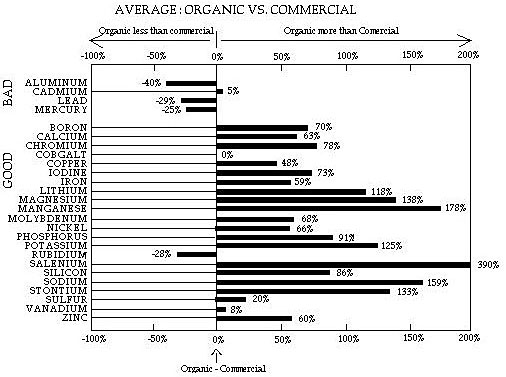
Organic food has been noted in various studies as having similar nutritional value as commercial foods. These studies usually look at the dry-ashed concentration and are designed for the food producer. In this study the average elemental concentration in organic foods on a fresh weight basis was found to be about twice that of commercial foods.

The difference in nutritional value of organic foods compared with commercial foods has been studied many times. These studies are intended and needed for the growers, but for the consumers interested in nutrition, what is needed? They go to a store and must choose between two potatoes or two pears. One is organic, one commercial. Each is about the same size and looks like the same variety. They need a simple, practical answer. Do the foods labeled organic have greater nutritive concentration?

Over a period of two years, foods were purchased at several stores in the western suburbs of Chicago. Apples, pears, potatoes, and corn were selected, choosing specimens of similar variety and size. Organic whole-wheat flour and wheat berries were obtained from catalogs and markets in the Chicago area. Baby foods and “Junior’ foods were also included in the study.

Specimens were taken to Doctor’s Data Laboratories, Inc. in West Chicago, IL for analysis of elemental concentrations. The method for sample preparation for the analysis of 38 elements is an open-vessel hot-plate acid digestion. A 0.4 gram specimen of food was weighed to ± .005 gr. A 1O ml mixture of ultra-pure nitric acid and perchloric acid in 3 to 2 ratio is heated with the sample until a clear liquid is obtained. Digested samples are diluted to a standard volume and analyzed on state-of-the-art instruments. Comparable specimens were always analyzed sequentially and often rerun to determine reproducibility of certain elements.

The four tables below provide the results of the testing except for that of the baby food. (In the studies of the baby food there were minor differences and these differences were inconsistent.) Graph 4 is a summary of Graphs 1-3.

Results are expressed as a comparison of the percentage of organic foods having more or less of each element as compared with the commercial foods. This is done to eliminate the influence of the matrix effect on the results. The matrix effect (caused by different viscosity, acidity and residue in the ashed specimen), of each food type must be studied to produce accurate numerical results. In this study, the matrices were not studied, so numerical results are not reported. Why so much difference when only minor differences have been noted before?

First, many prior studies compare dry weight values. Nitrogen(2), jibberelic acid and other substances can increase moisture content of a food. Second, commercial and organic farming may have changed in the past few years since many studies have been done. Thirdly, post harvest handling may make a difference not addressed in most studies.

Are the levels of elements in food important? The 1988 Surgeon General’s report on nutrition states that nutrition can play a role in the prevention of such diseases as coronary heart disease, stroke, cancer and diabetes. Nutritional Influences on Illness(3) cites studies that have found low levels of elements correlate with many health conditions, citing many studies which show that supplementation of these elements can reduc  symptoms.

Examples include: alcoholism, allergy, cancer, candidiasis, cardiomyopathy, chronic fatigue syndrome, diabetes mellitus, fatigue, headache, hypertension, obesity, premenstrual syndrome, and rheumatoid arthritis to name a few. These studies do not directly prove causation but do document correlation. The elements found to reduce symptoms are the same elements found in this study at greater concentrations in organic food.

The study has many limitations, but specimens taken over a two year period provided quite similar results. Despite the study’s limitation, this suggests there are significant differences between organic and commercial food. The organic pears, apples, potatoes and wheat had, on an average, over 90% more of the nutritional elements than similar commercial food and if sweet corn levels are included, Graph 3, the average difference is over 2.5 times.

Limitations include: except for wheat berries, specimens were obtained only in the western Chicago area; the number of specimens varied from 4 to 15 per food; only five foods were reported here; bioavailability of the elements in these foods was not addressed; purchases were made of foods labeled “organic”, and no attempt was made to verify whether they were correctly described.

This study found a significant difference between organic and commercial foods for the consumer interested in elemental concentrations. Further study would be suggested.

Potatoes: Organic vs. Commercial

Wheat: Organic vs. Commercial

Sweet Corn: Organic vs. Commercial

Average: Organic vs. Commercial

Originally published 2008. Source: Organic Foods vs Supermarket Foods: Element levels, by Bob L. Smith, Doctor’s Data Inc., West Chicago, published in the JOURNAL OF APPLIED NUTRITION, VOL 45-1, 1993, © International Academy of Nutrition & Preventive Medicine

References:
  1. Hornick. Sharon B. Factors affecting the nutritional quality of crops. Am. J. Alternative Ag., Vol. 7. Nos. I & 2, 1992.
  2. Kumar, Vinod, W.S. Ahlawat, and R.S. Antil. 1985. Interactions nitrogen and zinc in pearl millet: Effect of nitrogen and zinc levels on dry matter yield and concentration and uptake of nitrogen and zinc in pearl millet. Soil Science 139:351-356.
  3. Werbach, Melvyn R. Nutritional Influences on   Illness, 2nd Ed. 1993,Third Line Press, Tarzana, CA.

Also Read:

The Real Purpose of GMO’s — and It’s Not Feeding the World!

World’s Best Blenders – Check Out the Newest from Blendtec & Vitamix

This is a reprint of my legacy article from over 10 years ago covering the world’s best blenders available at that time, Blendtec and Vitamix. Both have brand new models available now that are even more amazing.

  • CLICK HERE for the classic Vitamix TurboBlend (comparable to the 4500).
  • CLICK HERE for the newest Vitamix Ascent Blenders.
  • CLICK HERE for the classic Blendtec 575 Blender.
  • CLICK HERE for the newest Blendtec Designer Blenders.


Two Different Designs Serve Two Different Needs!

Everyone tries to compare these two champions head-to-head, as if one is better than the other. But this is like comparing two great fighters to decide which one is better – the one with more power or the one with faster hands. In some matches, the fighter with more power will win. In others, speed is the deciding factor. For other people, either champ can deliver a knockout punch!

Choosing between the world’s best blenders, Blendtec and Vitamix, is sort of like that. Blendtec is sort of a power hitter. Vitamix has faster blades. In some situations, power is what you need. In others, blade speed works best. So it all depends on who you are and how you work rather than any particulars like blade speed or horsepower.

These two championship blenders work on entirely different principles so you may want to match how you work with how the blender is designed to work in order to make an intelligent choice. For that you have to understand the overall design concept for each blender. Both Vitamix and Blendtec are fine-tuned to match the horsepower of the motor to the blade speed (RPM’s), carafe design, blade design and intended user experience! Each is a champ in it’s own right.

My First Blender

No Blender IconMany years ago I had what I thought was a good quality low-cost blender. But I constantly struggled with it for making raw smoothies.  I probably spent twice as long on every smoothie, from having to chop ingredients before adding them to the blender to having to stand there and shake the blender to get things to mix. I could spend 20 minutes to make a smoothie that now takes less than half the time with a high-end blender.

Much worse, I also used to throw out a lot of nutrition! I did terribly wasteful things thinking they were just part of what it takes to make a smoothie, from cutting the tops off strawberries or tossing pineapples cores in the trash to carefully removing many of the edible seeds.  Now I just toss everything in my high-power blender and it all gets blended up into the smoothest most delicious smoothies you’ve ever tasted!

With my old blender I just put up with lumps in my smoothies. I thought it was normal! But those lumps – the unblended ingredients in my smoothie – were globs of valuable, expensive organic veggies or fruits that never going to get completely broken down and digested. You see, an inefficient blender WASTES NUTRITION, WASTES TIME and WASTES MONEY!

If you are interested in a healthy diet, especially raw food, and are still struggling with a typical consumer blender, you are probably frustrated with like I was. Ordinary consumer models just don’t cut it for raw pates or thick green smoothies!  And the idea of spending $4-500 or more for a blender isn’t palatable at all…until you realize that a high-end, high-power blender quickly pays for itself when you stop wasting money and nutrition!

Healthy Competition: High-End Blenders

Blendtec 675 Blender
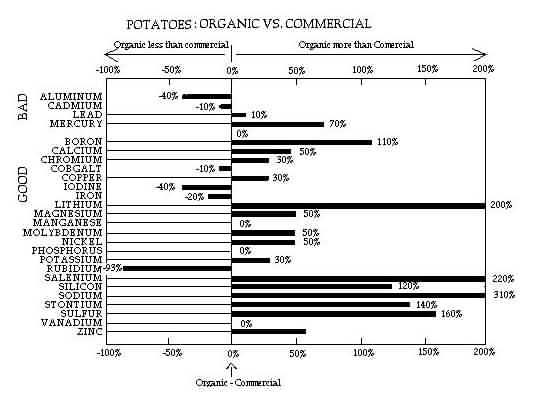
After reading all the articles about these blenders that I could find, I learned that nobody is actually giving you the real scoop! That’s what happens when articles and web sites are written to sell you something rather than provide useful, factual and relevant content that educates you to make your own informed choice! Instead you get a bunch of personal opinions and product specs that just ends up making you more confused than ever!

Of all the blenders on the market, there are only two brands that stand out as the world’s best blenders by professionals, from raw food authors and teachers to professional chefs. First, there are the popular Vitamix blenders. A venerable stainless steel Vitamix 3600 was my first high-power blender, purchased over 20 years ago. For decades Vitamix was the only choice. Today it is still preferred by people who insist on total manual control.

Then Blendtec came on the scene with the Designer series featuring more horsepower and a reputation for being able to blend anything from golf balls to iPods. This upstart is now the blender of choice for people who prefer automatic preprogrammed functionality without the need for a tamper.

How does a $500.00 blender make a better smoothie!

Vitamix Ascent A2300 BlenderFrom a raw food perspective, the first thing you need to understand about the world’s best blenders is that a high-end blender doesn’t just blend or mix up what you put in it. A high-end blender does much, much more! These benders have motors is 5 to 10 times more powerful than an ordinary kitchen blender, and blades that reach tip speeds approaching the speed of sound! This is not just for show!

With this much speed and power, the blades in these powerful machines hit your spinach, kale, bananas, almonds and everything else with a powerful force that literally explodes the cell walls of your ingredients, instantly releasing all the dense nutrients and flavors trapped inside.

That would be hard for your stomach to do even if it wasn’t already compromised by a lifetime of consuming dead, cooked and processed foods!

However, this only happens with one of the world’s best blenders. If you make a smoothie in an ordinary blender it may mix up the ingredients somewhat, but the effect won’t be the same. Instead of blasting through cell walls releasing tons of nutrition, you’ll get liquidized vegetables but still mostly intact at the cellular level, requiring much more effort for your system to absorb.

Of all the blenders on the market, there are only two brands that stand out as the absolute best among professionals, from raw food authors and teachers like myself to professional chefs. First, there is the popular Vitamix.  A stainless steel Vitamix 3600 was my first high-power blender, purchased over 25 years ago. I treasured that blender for over two decades!  For most of that time, the  Vitamix was the ONLY choice.  Today it is still preferred by professional chefs who insist on total control.

Then Blendtec came on the scene featuring more horsepower and a reputation for being able to blend anything from golf balls to iPods. But to determine which blender is the best for you, especially if you are enjoying a raw food lifestyle, you have to look further than horsepower and golf balls.

Vitamix and Blendtec are not really competing directly!

The first thing everyone looks at are Product Specifications. However, the specs don’t tell the whole story. For example, most people assume that a 3 HP motor is better than a 2 HP motor because it seems more powerful. But that isn’t true at all. The truth is that it you have to understand the overall design, from how the blade design and speed interact with the the design of the carafe and control system. The Vitamix and Blendtec are not competing directly at all! They are actually two entirely different philosophies of blender design – and will mostly appeal to entirely different groups of people.  The right question to ask is not which is the best blender but which is the best for you! With that in mind, let’s looks at the specs.

Power vs. Speed

Blendtec vs. Vitamix Motor
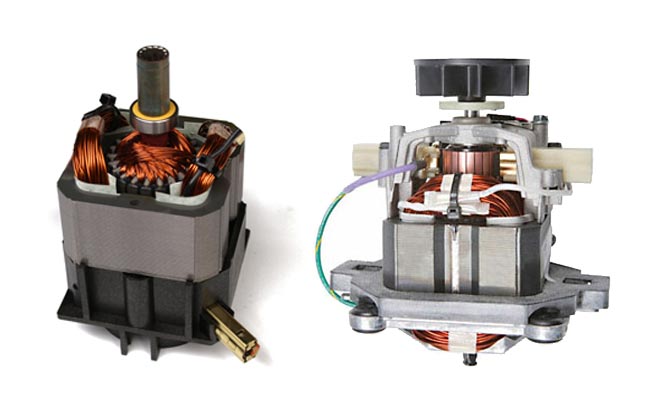
Vitamix has a long history. Many people that have been loyal Vitamix fans for decades. Their blenders are often preferred by professional chefs who prepare dozens of thick, dense recipes daily.  In a commercial kitchen, chefs prefer more manual control. A chef often wants to be able to manually control the speed and texture of his mix as his uses the famous Vitamix Tamper tool to push ingredients down into the blades carefully. Vitamix also has 4 star-shaped blades that are sharper, cutting through the ingredients at 39,000 RPM.  The carafe is tall and fluted, concentrating the ingredients in a narrower space and along the fluted curves for easy reach with the famous Vitamix Tamper tool. This combination of elements requires about 2 horsepower for the most efficient blending. In fact, too much horsepower could actually make it less efficient! In a Vitamix the Tamper can freely move in and out of the container during blending. The Vitamix tamper is designed to be used ALL the time since the fluted container is actually designed to concentrate the ingredients towards the tamper tool during blending.

The Blendtec design team took an entirely different approach, opting for slightly less speed but a lot more power and automation. This is great for people who want to just push a button and just let the bender do its thing — completely without any need at all for a tamper tool. The powerful 3 horsepower motor drives the 2-pronged blades, which are designed purposely with a relatively dull edge, into the ingredients at about 28,000 RPM — smashing open the cell walls of your fruits and vegetables. With a bigger motor, these blades are slower but have more power behind them, like a car going uphill in 1st gear.

Next, a large, wider and shorter square carafe, designed to take advantage of all that power. creates a strong vortex inside the carafe that sucks everything down into the blades without the need for a tamper. You just push a preprogrammed button and walk away. If you need to you can use the speed control for a little more manual control. You can even buy a special tamper tool online to fit your Blendtec if you really want one — or just make your own from a strong wooden dowel. However, I have been using my Blendtec for many years and always get perfectly smooth smoothies every time without ever needing a tamper. The large blade and square pitcher design does just what the sales literature says — pulling all the ingredients into the blades with a powerful vortex.

Occasionally, I will make a green smoothie with four or more large handfuls of greens and I’ll need to “pulse” the blender a few times or shake the pitcher a bit to get all the ingredients cycling into the blades, but I won’t have to stand there the whole time pushing the ingredients down with a tamper.

A larger, 3-quart pitcher is also available through Blendtec that has a larger, 4-inch blade and handles more capacity.. If you think you’ll be making a lot of smoothies with entire bunches or heads of greens (or you’re making smoothies for more than 2 people), I highly recommend opting for the extra,larger 96 oz. pitcher. The standard pitcher, however, is definitely adequate for most people.

The Blow-by-Blow Details

Minimum Authorized Price: Vitamix and Blendtec are both high-end, high-speed, powerful blenders. The base models, which I recommend most often, usually sell for under $500. The Blendtec, however, comes with everything you need to blend both wet and dry ingredients. Vitamix, due to the narrower, fluted design, has a separate dry pitcher for grinding grains into flower and blending other dry ingredients, which is sold separately. Both Vitamix and Blendtec offer a 7 year warranty — longer than any other blenders I have seen.

Power/Speed: The Vitamix blender features a 2 horsepower motor that spins up to 39,000 rpm. The Blendtec blender features a 3 peak horsepower, 1560 watt motor that spins it’s blade up to 29,000 rpm. However, because of the less powerful  motor in the Vitamix it can slow down significantly during a thicker blend. Blendtec’s greater horsepower means that is “goes uphill in low gear” better than the Vitamix, maintaining blade speed in even very thick mixes.

Warranty: Both Vitamix and Blendtec have a 7-year warranty that covers the entire machine, so this is a tie between the two machines.

Durability: Both Blendtec and Vitamix feature break-resistant, BPA-free, copolyester pitchers, stainless steel blades and durably-built base. Both will pulverize hard materials such as ice, frozen fruits, nuts, seeds, grains and coffee beans, though for dry ingredients you need to buy a different blender for the Vitamix.

NOTE: recently some folks have complained about using ANY plastic containers at all out of fear of contamination from toxic chemicals. I have researched this thoroughly and can tell you that this concern doesn’t seem to be a real issue at all. Virtually ALL, every single one, of the studies done that show any problems with Tritan plastic that I have carefully read use extreme hot ingredients, over 104 degrees, and ridiculously long exposure times, over TEN DAYS, to get even a negligible result, Using these products safely and as directed would never create that kind of exposure or problem. Even if there was a very slight possibility of some miniscule exposure to something that may be toxic under some laboratory conditions, the MAJOR health benefits of the delicious, organic, nutritious smoothies I drink every day far outweigh any of that by miles!

Dimensions: Blendtec is shorter at 15 1/2 inches tall with pitcher, which means that it can fit under most kitchen cabinets. Vitamix blenders are taller at 20 1/2 inches with pitcher, so it will take up a little more space in your kitchen and might not be able to fit nicely under your kitchen cabinets. The width and depth are pretty similar but the Blendtec, with a bigger motor, weighs 12 pounds vs. Vitamix’s 10 pounds.

Pitcher/Carafe: Both blenders come with a 64-ounce pitcher made from a durable, break-resistant plastic called Tritan, which is BPA-free. Unlike the Vitamix, the Blendtec blade is part of the pitcher, so if the pitcher should need replacing, you’re also replacing the blade. Of course, the blade assembly is guaranteed for life, so if it needed replacing it wouldn’t cost you a thing, New Blendtec pitchers are also fairly inexpensive, available online for under $60. Blendtec also has a 96-ounce pitcher that you can buy separately, or is included at a good discount if you order it with the Combo option.

The wider, square Blendtec pitcher design also makes it easier to pour smoothies and scrape out thick mixes like salad dressings or nut butters. The pitcher is easier to clean, as well. With the Vitamix, on the other hand, it can be more difficult to scrape out all the ingredients caught beneath or around the blades in it’s narrow, fluted pitcher design.

Controls – Preprogrammed vs. Manual: The Vitamix at this price point features a manual switch and dial interface for more precise, manual control of your mix. One of the problems with dials and switches, however, is that they can be hard to clean. Blendtec features a preprogrammed push-button interface which wipes clean easily. You can set speeds manually when needed by pressing the “up” or “down” buttons, but for most things you just push a button and walk away.

Tamper Tool: Vitamix includes a tamper which pushes the ingredients down the fluted sides and into the blades of the blender. This gives you more manual control, which some serious cooks and gourmet chefs prefer. Blendtec, however, is designed to create a vortex in the pitcher that sucks all the ingredients down into the blades without the need for a tamper. In my experience, smoothies blend perfectly in the Blendtec without the need for a tamper. It really does pull all the ingredients into the blades. For thicker blends you may need to hit the pulse button a couple times before running the smoothie cycle. I can certainly live without a tamper but if you need one you can find a custom, aftermarket tamper for Blendtecs on eBay very inexpensively.

To make your own tamper tool use a 1 inch Poplar wood dowel and a 3/16 inch wood dowel from your local lumber yard or hardware store. Measure from the top of the blade inside the container to the top of the lid when in place on top of the container, then cut your 1dowel to a comfortable length, about 12 inches. Drill a hole through the position where the 3/16 inch dowel will be placed through the lid (in a cross), then cut your 3/16 inch dowel to about 6 inches or so. Make certain that the bottom of the dowel  doesn’t touch the blade.

Noise Level: The Vitamix sounds slightly less noisy than the Blendtec, but not by much – and if you push the button and walk away you won’t hear a thing anyway, whereas with the Vitamix you have to stay there and listen to it the whole time whole you’re pushing the ingredients into the blade with the tamper.

Cleaning: Both Vitamix and Blendtec are easy to clean – just put a little hot water and a drop of dish soap in the pitcher and push the pulse button for a second or two. Occasionally you may need to get in there with a brush for a more thorough cleaning. Since the Blendtec pitcher is wider and has smooth sides, it is much easier to clean than the tall, narrow and fluted Vitamix pitcher.

Blades: The Vitamix features a four-tipped, sharpened blade designed to work with the higher RPM’s of the motor to cut through the tough cellulose wall of cells. Blendtec has a dual-prong unsharpened blade designed to crash with a lot more force through cell walls using the power of it’s 3 HP motor.

Color/Design: The Vitamix is a more stylish, modern design that features a variable speed (VSD) control. It only comes in black. The Blendtec has a sleek, modern, high-tech design which is available in black, white or red.

Customer Support: While Blendtec has a very popular “Will It Blend” video campaign on YouTube, Vitamix has more information-packed content on its website that contains a forum, recipes, nutrition information and specific content catering to raw foodists or vegetarians. Vitamix generally features more healthy recipes than Blendtec. However, this isn’t a reason to choose one machine over another – you can find numerous web sites with recipes that work with either machine online.

Performance: Either blender will do amazingly when making silky, delicious smoothie . Neither one outperforms the other — they just work slightly differently. Both blenders break up the cell walls of your ingredients, unlocking the nutrients in fruit, vegetables, nuts and seeds far, far better than any typical consumer blender can. Both Vitamix and the Blendtec make smoothies, nut butters, hot soup, frozen ice cream, crush ice and grind grains. So it all comes down to how you want to work – manually, standing over the blender and nursing the mix by hand or automatically, pushing a preprogrammed button and walking away.

Who ‘s the Winner?

This is one of those age-old questions for which there is no easy answer. It’s like asking if a Apple computer is better than a Windows PC or if a Canon DSLR camera is better than a Nikon. It’s a matter of your own personal style and taste. Everyone I know who has a Blendtec loves it, and everyone I know with a Vitamix loves it, too. So study my comparisons carefully, think about how you work in your kitchen and see which one feels right for you. Personally, I used to have a classic stainless steel Vitamix which I loved for many years. For the last five years or so I’ve used a Blendtec and I love it, too – perhaps just a bit more than I loved the Vitamix. I like just pushing a button and walking away. But you won’t be disappointed with either so don’t get all stressed out over the decision – just get one of these great blenders and start enjoying healthy green smoothies and delicious raw food recipes as soon as you can!

Also Read:

Raw Food Basics — How to Enjoy a Raw Food Lifestyle

Why We Really Don’t Need GMO Foods

What the mainstream media aren’t telling you.

San No to GMOsThis list below of 10 reasons why we don’t need GMO foods is really is just a summary of a much larger problem of particular importance to raw foodists. You see, GMO foods (and other engineered food products being currently developed)  are probably the biggest threat to your health and the planet in  history. Personally, I think it is a bigger, more immediate threat than even Global Warming or Fukushima! To be successful, as well as healthy, a raw foodist MUST have access to healthy, natural organic or Non-GMO foods.

Healthy foods’ #1 enemy are GMO’s. They don’t just threaten to put organic farmers out of business, they already do it every day — contaminating organic crops with out-of-control franken-genes that drift through the air. Then these  FrankenFood  companies, like Monsanto, have the temerity to sue the poor farmers they just ruined for growing their patented crops. Since these giant corporations control the courts with deep pockets, armies of lawyers and who knows what else, they usually win these ludicrous cases!


I believe that without healthy, delicious and nutritionally dense non-GMO or organic food you cannot be successful as a raw foodist. Period. So study the facts for yourself, learn the truth and be empowered to make your own healthy choices.


In his new book, Genetic Roulette, Jeffrey M. Smith (a contributor to this website), provides a more detailed analysis of the documented health risks of GMO’s. If you like his book Seeds of Deception, you’ll be blown away by this one. Smith gives you the ammunition you need to shatter the biotech industry’s claim that genetically modified (GM) foods are safe. When you read the sample that follows, it becomes blindingly clear that the so-called “science” of genetics is more dangerous than anyone thought:

Rat Tumors
Longest-Running Safety Study Finds Tumors in Rats fed Monsanto GMO’s


  • Evaluation of gene insertion sites have shown relocations of up to 40,000 DNA base pairs, mixing together of foreign and host DNA, large scale deletions of more than a dozen genes and multiple random insertions of foreign DNA fragments.
  • During insertion, the foreign gene may become truncated, rearranged or interspersed with extraneous pieces of DNA. The proteins produced by the distorted foreign gene may be misfolded or have added molecules, so they may operate differently and be harmful in unpredictable ways.
  • One study using a micro-array gene chip found that 5% of the host’s genes changed their levels of expression after a single gene was inserted.
  • The promoter used in nearly all GMO crops permanently turns on the foreign gene at high output. Scientists had thought the promoter would only turn on the foreign gene, but, in fact, it can accidentally turn on other natural plant genes–permanently–genes that may overproduce an allergen, toxin, carcinogen or anti-nutrient, or regulators that block other genes.
  • When certain viruses infect an organism, they splice themselves into the host’s DNA. If the GMO promoter is inserted in the vicinity of a dormant virus, it might switch it on, resulting in virus activation.
  • In GMO Roundup Ready soybeans, the “stop signal” placed at the end of the gene cassette is dysfunctional, so longer than intended RNA proteins are produced, which are further rearranged into four non-intended variants, any one of which might be harmful.
  • DNA changes in GMO plants can alter the amounts of the chemicals the plant naturally produces, increasing its output of toxins or decreasing the amount of protective phytonutrients produced. For example, GMO soybeans produce less cancer-fighting isoflavones.
  • GMO proteins in soybeans, corn and papaya are similar to known allergens and may cause allergies.
  • Transgenes survive digestion and can transfer to gut bacteria or move into the blood and organs, including passing through the placenta into the fetus and through the blood-brain barrier. The only human feeding trial ever published confirmed that genetic material from Roundup Ready soybeans transferred into the gut bacteria in three of seven human volunteers. Once in the human gut bacteria, the transferred portion of the transgene produced herbicide-resistant protein. If the antibiotic-resistant genes that have been inserted into most GM foods on the market were to transfer to pathogenic bacteria in the gut, antibiotic-resistant diseases could develop. If the transgene for the Bt pesticide were to transfer to our gut bacteria, we could become living pesticide factories.

Scary, huh!? The research and case reports that show what actually happens when animals and people consume GMO foods is not reassuring – and is not covered by the major media at all! Here are just a few more highlights from Smith’s book:

  • Rats fed Monsanto’s Mon 863 Bt corn for 90 days showed significant changes in their blood cells, livers and kidneys.
  • Rats were fed the GOM FlavrSavr tomato for 28 days. Seven of 20 rats developed stomach lesions (bleeding stomachs); another 7 of 40 died within two weeks.
  • About 25% of the sheep in herds grazing continuously on Bt cotton plants in India after the cotton harvest died within a week, according to reports from 4 villages. Post mortem studies suggested a toxic reaction.
  • Twelve dairy cows died on a farm in Hesse Germany, after being fed a diet with significant amounts of the GMO corn variety, Bt 176. Other cows in the herd developed a mysterious illness and had to be killed. Syngenta, the producers of Bt 176, compensated the farmer for part of his losses, but despite the farmer’s demands and public protests, no detailed autopsy reports were made available. More than 20 farmers in North America have reported that pigs fed GMO corn had low conception rates, false pregnancies or gave birth to bags of water. Both male and female pigs became sterile.
  • In mice fed GMO soy, production of alpha-amylase, an enzyme responsible for digesting starch, dropped by as much as 77%.
  • In male mice fed Roundup Ready soybeans, the structure and gene expression pattern of testicular cells changed significantly.
  • Female rats were fed Roundup Ready soy starting before conception and continuing through weaning. 55.6% of the offspring died within three weeks compared to 9% of non-GM soy controls. In another study, after a lab began feeding rats a commercial diet containing GMO soy, offspring mortality reached 55.3%. When offspring from the GM-fed rats were mated together, they were unable to conceive.
  • In 2003, approximately 100 people living next to a Bt cornfield in the Philippines developed skin, respiratory, intestinal reactions and other symptoms while the corn was shedding pollen. Blood tests of 39 people showed an antibody response to Bt-toxin. Symptoms reappeared in 2004 in at least four other villages that planted the same GMO corn variety.
  • GMO soy was imported into the UK shortly before 1999. Within a year, soy allergies in the UK had risen from 10% to 15% of the sampled population. Antibody tests show that some individuals react differently to GMO and normal soy varieties. GMO soy has higher levels of a known allergen.
  • One brand of the supplement L-tryptophan created a deadly epidemic in the U.S. in the 1980s. The company responsible had genetically engineered bacteria to produce the supplement more economically. The resulting product contained many contaminants, five or six of which were suspected as the cause of the disease. Not only the GM L-tryptophan supplement, but all L-tryptophan was removed, and still remains off the market.

My list of 10 reasons we don’t need GMO Foods.

1. GMO foods won’t solve the food crisis

39371932 - globe with fork and knife A 2008 World Bank report concluded that increased biofuel production is the major cause of the increase in food prices.[1]  GM giant Monsanto has been at the heart of the lobbying for biofuels (crops grown for fuel rather than food) — while profiting enormously from the resulting food crisis and using it as a PR opportunity to promote GM foods!

“The climate crisis was used to boost biofuels, helping to create the food crisis; and now the food crisis is being used to revive the fortunes of the GM industry.” — Daniel Howden, Africa correspondent of The Independent[2]

“The cynic in me thinks that they’re just using the current food crisis and the fuel crisis as a springboard to push GM crops back on to the public agenda. I understand why they’re doing it, but the danger is that if they’re making these claims about GM crops solving the problem of drought or feeding the world, that’s bullshit.” — Prof Denis Murphy, head of biotechnology at the University of Glamorgan in Wales[3]

2. GMO crops do not increase yield potential

Center for Responsible TechnologyDespite the promises, GM has not increased the yield potential of any commercialized crops.[4] In fact, studies show that the most widely grown GM crop, GM soya, has suffered reduced yields.[5]

“Let’s be clear. As of this year [2008], there are no commercialized GM crops that inherently increase yield. Similarly, there are no GM crops on the market that were engineered to resist drought, reduce fertilizer pollution or save soil. Not one.” — Dr Doug Gurian-Sherman, former biotech specialist for the US Environmental Protection Agency and former advisor on GM to the US Food and Drug Administration[6]

3. GMO crops increase pesticide use

30431095 - tractor spraying pesticides
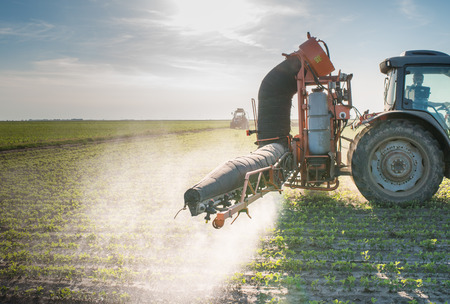
Official data shows that in the US, GM crops have produced an overall average increase, not decrease, in pesticide use compared to conventional crops.[7]

“The promise was that you could use less chemicals and produce a greater yield. But let me tell you none of this is true.” — Bill Christison, President of the US National Family Farm Coalition[8]

4. There are better ways to feed the world

A major recent UN/World Bank-sponsored report compiled by 400 scientists, and endorsed by 58 countries, concluded that GM crops have little to offer global agriculture and the challenges of poverty, hunger, and climate change, because better alternatives are available.[9]

5. Other farm technologies are more successful

43360964 - children picking veggies on organic farmIntegrated Pest Management and other low-input or organic methods of controlling pests and boosting yields have proven highly effective, particularly in the developing world.[10] Other plant breeding technologies, such as Marker Assisted Selection (non-GM genetic mapping), are expected to boost global agricultural productivity more effectively and safely than GM.[11]

“The quiet revolution is happening in gene mapping, helping us understand crops better. That is up and running and could have a far greater impact on agriculture [than GM].” — Prof John Snape, head of the department of crop genetics, John Innes Centre[12]

6. GMO foods have NOT been shown to be safe

iStock_000003556658XcropGenetic modification is a crude and imprecise way of incorporating foreign genetic material (e.g. from viruses, bacteria) into crops, with unpredictable consequences. The resulting GM foods have undergone little rigorous and no long-term safety testing, but animal feeding tests have shown worrying health effects.[13] Only one study has been published on the direct effects on humans of eating a GM food.[14] It found unexpected effects on gut bacteria, but was never followed up.

“We are confronted with the most powerful technology the world has ever known, and it is being rapidly deployed with almost no thought whatsoever to its consequences.” — Dr Suzanne Wuerthele, US Environmental Protection Agency (EPA) toxicologist

7. Stealth GMOs in animal feed without consumer consent can get in your steaks, burgers and chops!

Meat, eggs and dairy products from animals raised on GMO feed  do not have to be labelled. Studies have shown that if GM crops are fed to animals, GMO material can appear in the resulting products.[15] As GM foods have been shown to affect animals’ health, eating such “stealth GMOs” may affect the health of consumers.

8. No one is watching the impact of GMO foods on your health35893286 - businessman with blindfold

It is claimed that Americans have eaten GM foods for years with no ill effects. But these foods are unlabeled in the US and no one has monitored the consequences. With other novel foods like trans fats, it has taken decades to realize that they have caused millions of premature deaths.[16]

9. GMO and non-GMO foods cannot co-exist

GMO contamination of conventional and organic food is increasing. An unapproved GM rice that was grown for only one year in field trials was found to have extensively contaminated the US rice supply and seed stocks.[17] In Canada, the organic rapeseed industry (Canola oil) has been destroyed by contamination from GMOs.[18] In Spain, a study found that GMO maize “has caused a drastic reduction in organic cultivation and is making their coexistence practically impossible”.[19] The time has come to choose between a GMO-based, or a non-GMO-based world food supply.

“If some people are allowed to choose to grow, sell and consume GM foods, soon nobody will be able to choose food, or a biosphere, free of GM. It’s a one way choice, like the introduction of rabbits or cane toads to Australia; once it’s made, it can’t be reversed.” — Roger Levett, specialist in sustainable development[20]

10. We can’t trust GMO companies

The big biotech firms pushing their GMO foods have a terrible history of toxic contamination and public deception.[21] GMOs are attractive to them because it gives them patents that allow monopoly control over the world’s food supply. They have been harassing farmers for the “crime” of saving patented seeds or “stealing” patented genes — even if those genes got into the farmer’s fields through accidental contamination by wind.[22]

“Farmers are being sued for having GMOs on their property that they did not buy, do not want, will not use and cannot sell.” — Tom Wiley, North Dakota farmer [23]

Excerpts Courtesy of GM Watch, BanGMFoods.org, et al. (see below)

References
  1. “A Note on Rising Food Prices”, Donald Mitchell, World Bank report, 2008.
    http://image.guardian.co.uk/sys-files/Environment/documents/2008/07/10/Biofuels.PDF
  2. “Hope for Africa lies in political reforms”, Daniel Howden, The Independent, 8 September 2008, http://www.independent.co.uk:80/opinion/commentators/daniel-howden-hope-for-africa-lies-in-political-reforms-922487.html
  3. “GM: it’s safe, but it’s not a saviour”, Rob Lyons, Spiked Online, 7 July 2008, http://www.spiked-online.com/index.php?/site/article/5438/
  4. “The adoption of bioengineered crops”, US Department of Agriculture Report, May 2002
  5. “Glyphosate-resistant soyabean cultivar yields compared with sister lines”, Elmore, R.W. et al., Agronomy Journal, Vol. 93, No. 2, 2001, pp. 408–412
  6. “Genetic engineering – a crop of hyperbole”, Doug Gurian-Sherman, The San Diego Union Tribune, 18 June 2008, http://www.signonsandiego.com/uniontrib/20080618/news_lz1e18gurian.html
  7. “Genetically engineered crops and pesticide use in the United States: The first nine years”, Benbrook, C., BioTech InfoNet, Technical Paper No. 7, October 2004, http://www.biotech-info.net/Full_version_first_nine.pdf
  8. “Agricultural Pesticide Use in US Agriculture”, Center for Food Safety, May 2008, using data from US Department of Agriculture
  9. “Family Farmers Warn of Dangers of Genetically Engineered Crops”, Bill Christison, In Motion magazine, 29 July 1998, http://www.inmotionmagazine.com/genet1.html
  10. “International Assessment of Agricultural Knowledge, Science and Technology for Development: Global Summary for Decision Makers (IAASTD)”, Beintema, N. et al., 2008, http://www.agassessment.org/index.cfm?Page=IAASTD%20Reports&ItemID=2713
  11. See, for example: “International Assessment of Agricultural Knowledge, Science and Technology for Development: Global Summary for Decision Makers (IAASTD)”, Beintema, N. et al., 2008,<a>http://www.agassessment.org/index.cfm?Page=IAASTD%20Reports&ItemID=2713
  12. “Feeding the world?”, J. N. Pretty, SPLICE (magazine of the Genetics Forum), Vol. 4, Issue 6, August/September 1998; “Organic agriculture and food security in Africa”, United Nations report, 2008, http://www.unep-unctad.org/cbtf/publications/UNCTAD_DITC_TED_2007_15.pdf
  13. “Marker-assisted selection: an approach for precision plant breeding in the twenty-first century”, Collard, B.C.Y. and D.J. Mackill, Phil. Trans. R. Soc. B, Vol. 363, 2008, pp. 557-572, 2008
  14. “Breeding for abiotic stresses for sustainable agriculture”, Witcombe J.R. et al., Phil. Trans. R. Soc. B, 2008, Vol. 363, pp. 703-716
  15. “Gene mapping the friendly face of GM technology”, Professor John Snape, Farmers Weekly, 1 March 2002, p. 54
  16. 13.Here is just a small selection of these papers: “Genetically modified soya leads to the decrease of weight and high mortality rate of rat pups of the first generation”, Ermakova I.V., EcosInform, Vol. 1, 2006, pp. 4-9
  17. “Fine structural analysis of pancreatic acinar cell nuclei from mice fed on GM soybean”, Malatesta, M. et al., Eur. J. Histochem., Vol. 47, 2003, pp. 385–388
  18. “Ultrastructural morphometrical and immunocytochemical analyses of hepatocyte nuclei from mice fed on genetically modified soybean”, Malatesta, M. et al., Cell Struct Funct., Vol. 27, 2002, pp. 173-180
  19. “Ultrastructural analysis of testes from mice fed on genetically modified soybean”, Vecchio L. et al., Eur. J. Histochem., Vol. 48, pp. 448-454, 2004
  20. “A long-term study on female mice fed on a genetically modified soybean: effects on liver ageing”, Malatesta M. et al., Histochem Cell Biol.,  Vol. 130, 2008, pp. 967-977
  21. “Effects of diets containing genetically modified potatoes expressing Galanthus nivalis lectin on rat small intestine”, Ewen S.W. and A. Pusztai, The Lancet, Vol. 354, 1999, pp. 1353–1354
  22. “New Analysis of a Rat Feeding Study with a Genetically Modified Maize Reveals Signs of Hepatorenal Toxicity”, Séralini, G.-E. et al., Arch. Environ. Contam. Toxicol., Vol. 52, 2007, pp. 596-602.
  23. “Assessing the survival of transgenic plant DNA in the human gastrointestinal tract”, Netherwood T. et al., Nature Biotechnology, Vol. 22, 2004, pp. 204–209.
  24. “Detection of Transgenic and Endogenous Plant DNA in Digesta and Tissues of Sheep and Pigs Fed Roundup Ready Canola Meal”, Sharma, R. et al., J. Agric. Food Chem., Vol. 54, No. 5, 2006, pp. 1699–1709
  25. “Assessing the transfer of genetically modified DNA from feed to animal tissues”, Mazza, R. et al., Transgenic Res., Vol. 14, No. 5, 2005, pp. 775–784
  26. “Detection of genetically modified DNA sequences in milk from the Italian market”, Agodi, A., et al., Int. J. Hyg. Environ. Health, Vol. 209, 2006, pp. 81–88
  27. “Trans Fats: The story behind the label”, Paula Hartman Cohen, Harvard Public Health Review, 2006, http://www.hsph.harvard.edu/review/rvw_spring06/rvwspr06_transfats.html
  28.  “Risky business: Economic and regulatory impacts from the unintended release of genetically engineered rice varieties into the rice merchandising system of the US”, Blue, Dr E. Neal, report for Greenpeace, 2007, http://www.greenpeace.org/raw/content/international/press/reports/risky-business.pdf
  29. “Seeds of doubt: North American farmers’ experience of GM crops”, Soil Association, 2002, http://www.soilassociation.org/seedsofdoubt
  30. “Coexistence of plants and coexistence of farmers: Is an individual choice possible?”, Binimelis, R., Journal of Agricultural and Environmental Ethics, Vol. 21, No. 2, April 2008
  31. “Choice: Less can be more”, Roger Levett, Food Ethics magazine, Vol. 3, No. 3, Autumn 2008, p. 11, <a>http://www.foodethicscouncil.org/node/384</a>
  32. See, for example, Marie-Monique Robin’s documentary film, “Le Monde Selon Monsanto” (“The World According to Monsanto”), ARTE, 2008; and the website of the NGO, Coalition Against Bayer-Dangers, www.cbgnetwork.org
  33. GM company Monsanto has launched many such lawsuits launched against farmers. A famous example is the case of the Canadian farmer Percy Schmeiser. Just one article on this case is “GM firm sues Canadian farmer”, BBC News Online, 6 June 2000,
    http://news.bbc.co.uk/2/hi/americas/779265.stm
  34. “Monsanto ”Seed Police” Scrutinize Farmers”, Stephen Leahy, InterPress Service, 15 January 2004, http://www.commondreams.org/headlines05/0115-04.htm

(C) 2008-2017, RawFoodLife, LLC

Also Read:

Organic & Non-GMO Foods — Our Last Defense from Monsanto & Friends!

Here Comes the Food Police – Corporate Greed & the Battle for Your Food

0

Over the last ten or fifteen years I’ve written many times about GMO foods as one of the biggest threats to raw foodists — and everyone else. GMO’s however are only one tool in the arsenal of the corporations trying to control their intellectual property — the world’s food supply! Corporate greed for money and power make them see the entire world as their rightful market. After all, everyone has to eat! So they patent seeds that can bankrupt third-word farmers, sue hapless farmers that accidentally grow their crops, and much worse. Now you can also can add “nano-particles” the their list of laboratory-grown Frankenfoods, with many more horrors coming soon from the folks that brought you agent orange.

30431095 - tractor spraying soyI am not a conspiracy nut, however I am definitely someone who’s concerned about Monsanto (and related corporations through interlocking boards of directors) being the force behind GMO’s, as well as the power behind the scenes of the FDA. And they’ve clearly demonstrated aggressive legal enforcement of their patent “rights,” suing every farmer that has GMO seeds blown by the wind onto his organic farm thus destroying his farm. So it isn’t beyond Monsanto and their ilk to misuse our laws to meet their needs at every opportunity.

Monsanto investigators go out every day looking for farms that are inadvertently growing Roundup Ready produce without a contract. They look in the areas within the natural “genetic drift” on the wind of GMO pollen. When they find a field of corn that has been contaminated by GMO pollen, destroying the farmer’s entire business, they turn things inside out by suing that farmer for patent infringement (see Monsanto vs Schmeiser, for example).

This corporate policy of not only ignoring the dangers of genetic drift but profiting from it could legally be “negligence.” They ruined the hapless farmer’s crops with genetic contamination, but with armies of lawyers, deep pockets and other forms of “undue influence,” they actually win these bizarre cases even though the contamination was their own fault. Of course, it should be the farmer that wins and get reimbursed for the destruction of his organic farm. Instead, they ruin the farmer by destroying his crops, then they sue him for having the temerity to be growing crops downwind from them. Then they ruin him financially, take his farm away and plant more dangerous GMO’s.

Organic Food Could Become what Marijuana was once like.

Long ago it was legal to grow hemp. Although industrial hemp was one of the most profitable products in the world, it competed directly with the powerful corporations that owned thousands of acres of timber and cotton plantations. Hemp grown for paper and fabric has almost none of the psychoactive substances needed to get “high”… and is legally grown these days in several states. Still, many hemp farmers are raided by Federal agents with automatic weapons in Kevlar body armor. The corn fields of tomorrow could also be host to Kevlar-clad jack-booted troops if we don’t do more to protect our farmers. .. and our rights.

Something similar it has already happened to thousands of holistic doctors trying to find natural healing alternatives to pharmaceuticals. Not only are holistic medical doctors getting their offices raided by FDA officers for prescribing vitamins instead of drugs, they are mysteriously dying every week all over the USA. The pharmaceutical companies and agribusiness conglomerates have one thing in common — they understand that the best thing they can do to make a profit is to gain complete control over their markets. And who is that? You and me!

The True Meaning of Freedom Today

49949650 - American Flag PlateAs raw foodists we MUST have access to healthy, nutritionally-dense organic food. But organic foods’ #1 enemy are GMO foods. These “corporate terrorists” are already controlling our country’s food supply with their deep pockets, political influence and who knows what else! And they  are gunning to have more effective, direct control — after all, why spend millions on attorney fees, court cost, political donations, lobbyists and outright bribes when you can just call “the Food Police” and have them take care of it for you at public expense!

Without healthy, delicious and nutritionally dense ORGANIC FOOD, you cannot be truly successful as a raw foodist — or even as a Freedom loving American! So study the facts for yourself, learn the truth and be empowered in your own healthy choices … and don’t forget to contact your own state and federal representatives to stop the “Food Police” now.

This is Mind Control

Corporations and governments have been trying to control what you eat and drink for decades. They know that unhealthy people do not think clearly — and are not aware of the truth about their food and lifestyle choices. Combined with controls over air and water, it gives them total control over a population who can no longer think for themselves.  The idea is to make people so frightened by e-coli or something that they would give away their liberty without even realizing it. Terrorism, food contamination and the skyrocketing costs of health insurance have almost put an end to the U.S. Constitution.

45261469 - brain painAfter a series of well-orchestrated cases of food contamination – e coli-tainted meat, melamine-adulterated pet food and baby formula, salmonella-infected peanut butter, the public was primed for a series of so-called “food safety” bills. These pieces of legislation can often be traced directly to recommendations made by organizations controlled or influenced by Monsanto. The Trust for America’s Health, for example, is a non-profit organization sponsored by the Robert Wood Johnson Foundation. Michael R. Taylor, JD, who used to work at King & Spaulding, Monsanto’s law firm, once wrote a paper for the “Trust” on “Restructuring Food Safety at HHS.”

When I studied years ago, I tried to figure out some of these things. I learned one very important concept in law – whoever controls the definitions wins! You see, in law, legal definitions of a word can mean the opposite of it’s conversational meaning – what it means in the law if the opposite of what you think it means! This redefining of reality is what actually underlies all the losses of liberty we have in America today. For example, the title of a bill, and all the headlines and sub-headlines in the legislation, have absolutely no legal effect. They are there just to help organize it, so to speak. Only the actual text of the legislation has legal effect. So they can make the Title and Headlines say anything at all, whatever is expedient, whatever has the right “spin.” For example, they can call a bill the “Food Safety Bill” when it is in fact not designed to make food safer at all!

Non-profits, foundations and trusts can also call themselves whatever they want, too, regardless of their true intent. For example, a non-profit called the Trust for America’s Health, for example, has nothing whatsoever to do with your health — they measure America’s “health” in terms of quarterly corporate profits.

What Happens if we let corporations like Monsanto control our food supply
  • Healthy and even organic farms are taken over by government as though they were run by criminals and horribly contaminated corporate slaughterhouses and factory farms are left untouched;
  • the freedom of “we the people,” to make their own lifestyle choices, to grow healthy food and be left alone is destroyed, even though organic farms have never been the source of any food contamination;
  • the profit, control and power of corporations which are actually the source of the dangerous and unhealthy foods we eat, is vastly increased.

Thanks to corporate control over your reality, instead of cleaning up corporate slaughter-houses and feedlots featuring acres of contamination we end up with the control or elimination of farmers’ markets, locally grown produce and organic food. A Food Police State is not that far off. History has shown us that when you give people power they ultimately will abuse it. So you will see police-like actions down on the farm, from the imposition of surveillance to electronic monitoring and warrantless entry to prison terms for farmers illegally growing banned or contaminated organic crops — which some day could include your own backyard garden!

Also Read:

Raw Food & Liberty – The Battle for Control of What You Think

Are You Eating Raw, Live Food But Drinking Dead, Lifeless Water?

0

Alkaline Ionized Water vs. Dead, Lifeless Water

One of the most important benefits of a raw food lifestyle is that it is “alkaline forming.” The standard American Diet (SAD) is an “acid-forming” diet, which leads to dis-ease. Yet after spending weeks or months, perhaps even years, learning to eat raw food – what are you still drinking? If the answer is water that’s been trapped in pipes for hundreds of miles or trapped in plastic bottles for months or years, then you are drinking dead, lifeless water. (See: “Bottled Water Is NOT The Answer” below).  Discover alkaline ionized water to get all the benefits you should be enjoying from your water!

Even if you have a good water filter or an expensive reverse osmosis system, you’re not getting the results you should be from your water. Many well-known, major brands of bottled water are nothing more than filtered tap water. Many brands of bottled water are made by companies like Coca Cola — and they’re all just high-priced, filtered tap water. In fact, a lot of bottled water products are more contaminated than the tap water they started  with! Reverse osmosis systems and distillers remove some contaminants – but they also remove everything else, including the minerals that make living, natural water alkaline and healthy — sometimes making your water slightly acidic!

Live Food, Live Water vs. Dead Food, Dead Water

Washijng Your Fruits and VegetablesThe difference between living water and dead water is similar to the difference between living food and dead food. Live, raw food is naturally alkaline-forming and free of toxins. Live water is also alkaline, but it is getting very hard to find these days. Even in rural areas the water is often unsafe to drink. It has been processed and chlorinated to the point that it is no longer living or “raw” water. It is “cooked” or processed – and is now more toxic than healthy in many cases! So it is essential, if you want to take responsibility for your own well-being, that you not only eat raw, live food, but that you drink live alkaline ionized water. And there is only one truly safe, reliable and affordable way to get that — make it yourself!

Water is necessary for every bodily function. The average adult body contains over 40 quarts of water, about 70% of body mass. Blood is: 83% water, muscles, brain and heart 75%, lungs 86%, kidney 83%, and eyes 95%. Water is necessary for digestion, absorption of nutrients, circulation, lubrication, and elimination. It is a flushing agent and cleanser for all body liquids. Water facilitates the transport of toxins away from cells and tissues, and ultimate elimination through the kidneys. As a major component of blood plasma, water is necessary in bringing life-giving nutrients to every cell of the body.

If your body is dehydrated, water will be allocated from less vital functions to critical areas such as the cardiovascular, nervous, and muscular systems. Over time insufficient water intake can lead to chronic dehydration, imbalance your body’s pH, and cause serious health problems. Drinking sufficient water each day is not only essential for life, but also a basic requirement for maintaining optimal health. When evaluating the amount of water you consume each day, you cannot include such liquid as coffee, soft drinks, or alcohol as they actually dehydrate your body. The amount each person should drink depends on body size, climate, and your exercise regimen.

A standard rule of thumb is to drink 1/2 ounce daily for every pound you weigh. However, recent studies have shown that the old rule of thumb is merely a guideline. Though you should try to drink plenty of alkaline ionized water, drink mostly when you are thirsty – you don’t have to force yourself to drink quarts and quarts every single day.

Acid/Alkaline Balance

Whether a liquid is alkaline or acidic is determined by its pH, which means “potential hydrogen.” The pH scale ranges from 0 (the highest acidity) to 14 (the highest alkalinity). 7 is neutral and your body should be around 7.2 to 7.5 or so:

• Blood: 7.37 – 7.43
• Saliva: 7.2 – 7.5
• Bile: 7.5 – 8.8
• Urine: 6.2
• Pancreatic Secretions: 7.5 -8.8
• Gastric Juice: 2.5

Your body has several systems for maintaining its vital acid/alkaline balance. Lungs breathe out increased amounts of carbon dioxide (CO2) when there are excessive amounts present. When CO2 is dissolved in liquid it forms carbonic acid. The kidney eliminates acid through urine. The blood is also equipped with complex systems to maintain proper pH. It is essential that blood pH be maintained at a level of about 7.4 which is in the alkaline range.

When the body is unable to maintain proper pH balance, there is danger that it will become overly acidic. Acids then accumulate causing illness. Although it is possible for the body to become overly alkaline, it is rare. The most common condition is a tendency toward acidosis caused by fast, processed and cooked foods, as well as environmental toxins and stress.

The Dangers of Acidosis

Acidosis is what happens when the acid/alkaline balance of your body has become overly acidic. Acidosis has been recognized as a contributing factor in many health conditions including gout, heartburn, gastritis, sore muscles, osteoarthritis, osteoporosis, skin diseases, obesity, frequent colds and flu’s, and more serious conditions such as heart disease and cancer. Disease thrives in an acidic environment, so the more acidic you are the more susceptible you are to disease. Some of the symptoms of acidosis include lack of energy, constipation, digestive problems, gout, joint pain, chronic skin rashes, allergies, high blood pressure, reduced immune functions, and weight gain.

Your Diet and Acidosis

The over consumption of acid-forming foods can be a major factor in causing chronic acidosis. Cooked meats, dairy products, and fried foods when consumed excessively can lead to an acid condition. Liquids such as coffee and alcohol can also create acidity. Insufficient intake of water can be another cause of acidosis, as water is necessary to wash acid wastes out of the body.

Both physical and mental stress can lead to acidosis. When the body is under stress it produces acids as a natural reaction. The adrenal glands in particular are involved in secreting the stress hormones, cortisol and adrenaline. These hormones lead to an accelerated metabolic stage that increases acid levels.

Lack of exercise can also contribute to acidosis. When you exercise, the body burns fatty acids as well as accumulated acids. Increased circulation improves the elimination of acid wastes. However, excessive exercise can result in the buildup of lactic acid in the muscles.

To maintain an alkaline body chemistry, eat as much raw, alkaline-forming foods as possible, including fresh vegetables, green salads, and fruits, while also reducing acid-forming cooked and processed foods. Also try to manage your stress and exercise moderately. Finally, the type of water you drink plays an important role in your acid/alkaline balance.

What is Alkaline Ionized Water?

Most water from clean, natural sources is alkaline. Today, however, most water comes from bottles or faucets. So it is usually filled with toxic chemicals as well as lower on the pH scale – sometimes even acidic. But you can easily and affordably get alkaline water by making it yourself!

An Alkaline Water “Ionizer” passes the water from your kitchen faucet through an advanced filter to remove contaminants, and then put through an ionization chamber where electrically splits the filtered water into alkaline water and acid water by running the pre-filtered water over positive and negative electrodes. The negative electrode attracts positive minerals, which are the alkaline minerals, to its chamber, while the positive electrode attracts negatively charged minerals, which are acid minerals, to its chamber. This ionization process takes place while the water is running through the water ionizer. A stream of alkaline water comes out of the stainless steel nozzle at the top of the unit, and the acid water comes out of the back to drain off into the sink. Approximately 70% of the water produced is alkaline and 30% is acid water.

Quality Alkaline Water Ionizers, such as Life Ionizers, have several levels of alkalinity. You can begin by drinking mildly alkaline water then slowly increasing the alkalinity over time. A water ionizer will typically produce water with a pH between 7 and 11. Alkaline water in the 8.5 to 9.5 range is sufficiently alkaline to produce the health benefits you are looking for.

Characteristics of Water Produced by an Alkaline Water Ionizer:
• Alkalinity between 8 and 11 pH
• Better Tasting
• Microclustered for better Hydration
• High –ORP or Antioxidant Activity
• Increased Oxygen
• Ability to Detoxify

Water from a Water Ionizer is “microclustered”, meaning it is grouped together in smaller clusters of 5-6 water molecules like clusters found in natural flowing spring water, instead of the 10-13 found in bottled or tap water. This makes it “microclustered” so it will be more easily absorbed and by your body. Ionized Water also has two antioxidant qualities – its negative charge and the presence of Hydroxyl ions. All liquids have an Oxidative Reduction Potential (ORP). Normal tap water has an ORP of +300 to +400 mv. It does not have any potential for reducing oxidation because its ORP is positive. Only a negative ORP can reduce or negate oxidation. Water produced by a quality Alkaline Water Ionizer typically has an ORP of about -250 to -400 mv, meaning it can act as an antioxidant that can reduce oxidation, neutralize harmful free radicals, and slow aging.

Alkaline ionized water acts an antioxidant, scavenging for and neutralizing free-radicals. Because alkaline ionized water has the ability to give up electrons, it can effectively neutralize and block free radical damage. Ionized Alkaline Water seeks out free radicals and converts them into oxygen, which your body can use for energy production and tissue oxygenation. Water produced by a water ionizer will contain a cloud of tiny bubbles of oxygen and Hydroxyl ion, oxygen molecules with an extra electron attached. Hydroxyl ions scavenge free radicals that cause cellular damage.

Alkaline Ionized Water as a Detoxifier

Water is essential for detoxification of the accumulated acid wastes in the body. Today’s “civilized” lifestyle exposes us to a broad spectrum of toxins, including those in the food we eat, toxins produced naturally as a by-product of normal metabolism, heavy metal exposure, water pollution, GMOs and air pollution. Even the best of diets with unprocessed, uncooked organic foods, contain some natural toxic substances that need to be neutralized and eliminated. Common examples of these natural toxins are glycol-alkaloids in certain vegetables and the molds and fungi found in some grains, peanuts, and some fruits.

Also, there are thousands of chemical pollutants in use for agriculture and industry that can find their way into our food supply – even on some organics foods that are exposed to the environment while growing and during shipping. Antibiotics and hormones are also used in animal products. In addition, common prescription drugs and over-the-counter medicines are often flushed down the toilet and eventually can find their way into the food supply Finally, your body produces it’s own normal toxic by-products such as urea and ammonia, that must be detoxified and eliminated, mainly by the kidneys.

Common heavy metals like lead, cadmium, arsenic, and aluminum are found in the environment and make their way into your body. Sources include pesticide sprays, cooking utensils containing aluminum, cigarette smoke, dental fillings, antiperspirants, and antacid medication. The absorption of these heavy metals from our environment build up slowly over time.

These toxins all need to be eliminated by the body. A raw food lifestyle, along with using a water ionizer helps you body overcome these challenges.

Alkaline Ionized Water & Weight Loss

Raw Food & Weight LossNearly 1 in 3 American adults is overweight. In “The pH Miracle for Weight Loss”, Robert O. Young, PhD, states that the cause of obesity in America “is a fundamental misunderstanding of how and why the body stores fat”. What matters most according to Dr. Young is keeping your body properly alkaline, rather that acidic. His book reveals that keeping your body sufficiently hydrated with Alkaline Water is critical in maintaining proper weight. Weighing too much is not as much about fat according to Dr. Young, as it is abut the overproduction and storage of fats produced by an acid-forming diet and lifestyle.

Dr. Young explains that the body uses fat in a desperate attempt to protect itself by using fats to bind up acids. But fat is used primarily as a way to store those acids. This is good – your body is protecting itself from damage from those acids. The bad news, however, is that in the long term those fat/acid deposits create health problems.” Consuming raw, alkaline-forming foods and drinking alkaline water every day helps you neutralize toxic acids and wash them out of the body, while preventing excess accumulation of those fats used to bind acids.

All About Acid/Alkaline pH and Negative -ORP

1. The American diet is extremely acidic.

  • Meat, including beef, pork, chicken and turkey are acidic.
  • Dairy such as milk, butter and cheese are acidic.
  • Grains such as rice and barley are acidic.
  • Beverages such coffee, tea, and soft drinks are very acidic.
  • Fruit and fruit juices contain high concentrations of acid.
  • Simple carbohydrates such as potatoes, pasta, and bread contain large amounts of acids.

2. Acidity in the body is related to disease.

  • Acid reflux is a painful condition that occurs when acidic stomach liquid backs up (refluxes) into the esophagus, causing irritation, inflammation and damage to the lining of the esophagus
  • High cholesterol occurs when the body produces excessive amounts of cholesterol to neutralize large amounts of acids in the blood stream before they damage living cells.
  • Heart disease is the result of a build-up of cholesterol in the coronary arteries that reduces the blood flow to the heart muscle. As stated above, cholesterol forms to product the arterial wall from acidity in the blood.
  • Fat is produced by the body to trap and neutralize acidic waste in the body. As Dr. Robert O. Young, author of The pH Miracle for Weight Loss, puts it, “The body retains fat as a protection against the overproduction of acids produced by the typical American diet….Your fat is actually saving your life.”
  • Inflammatory related diseases such as allergies, arthritis, fibromyalgia, psoriasis, and even stroke are related to low-grade metabolic acidosis.

Drinking alkaline water can help restore your body’s pH balance and reduce its acidity.

3. Your Drinking water should have a negative -ORP measurement.

  • The value of ORP quantifies the amount of energy in water by numbering electrons.
  • ORP values are expressed as millivolts, or mV.
  • Drinking water should have a negative mV number of at least -50mV.
  • Water with an ORP of -50mV will have enough negative ions to attract and neutralize excess acids.

4. Your Drinking water should have a pH level at or above 9.5.

  • pH is the measure of the acidity or alkalinity of a solution.
  • pH measures the concentration of hydrogen and hydroxide ions on a scale from 0 to 14, with 7.0 considered neutral.
  • Pure water at 25 °C has an equal concentration of dissolved hydrogen ions (H+) and hydroxide ions (OH-) and is considered “neutral.”
  • Solutions with a pH level below 7.0 are acids.
  • Solutions with a pH level above 7 are bases (alkaline).

The healthy human body contains both acids and bases. The organs maintain the pH of arterial blood between 7.35 and 7.45. To counteract the amount of acids consumed by eating, drinking, and breathing, the body will take alkaline substances from other body parts, such as bone. By drinking alkaline water, you are able to counteract the intake of acids and help the body regulate its pH in a more healthy way.

Alkaline Ionized Water Benefits

Restores the pH balance in the body.

  • Alkaline water can neutralize the acidity of the body caused by stress, modern diet, air pollution, and many bottled waters. Click here for the truth about bottled water.
  • A higher pH in the body reduces the need for fat and cholesterol to protect the body from damaging acids.Click here for weight loss information.
  • Alkaline water is negatively charged and an “antioxidant.” Antioxidants reduce cellular and DNA damage caused by free radicals.Click here for anti-aging information.
  • Negatively charged alkaline water creates energy by giving up ions to positive ions.
  • Alkaline water tastes lighter with a pleasantly sweet flavor.
  • Using water with a higher pH level improves the taste of beverages and food.
  • Cooking with alkaline water improves the taste and quality of foods and using acidic
    water when boiling eggs improves their quality. Click here for more information on acidity within the American diet.

Provides superior hydration and nutrition at the cellular level.

  • Ionization breaks clusters of water molecules into smaller micro-clusters, reducing the size of the clusters from the 11-16 molecules in standard water to just 5-6 molecules in ionized water. Smaller clusters pass through cell walls more easily and hydrate the cells more quickly.
  • Faster hydration allows the body to regulate its temperature more efficiently.
  • Micro-clusters of mineral-bearing ionized water also deliver nutrients more efficiently to the cells.
  • Detoxifies cells more efficiently than standard drinking water.
  • Due to their smaller size, micro-clusters of ionized water molecules are expelled from the cells more efficiently, carrying damaging toxins out of the cells and flushing them out of the system.
  • The negative charge of ionized alkaline water will attract the positive ions of acids and neutralize them within the body. Click here for more information on detoxification within the body.

[TABS_PRO id=2452]

Also Read:

“Microclusters” Help Live Water Easily Penetrate Your Cell Walls